Private markets have grown exponentially over the past decade, affecting a wide array of investments.


Published: April 18, 2023
Leveraged finance has felt a significant impact because of the growth of private lending and the interconnectedness of public and private lending. Credit markets now face some of the most challenging financial and economic conditions in over a decade. It is likely that transparency and liquidity — two factors that differentiate public and private lending — will be critical to how investors and private equity weather the storm.

Private markets have grown exponentially over the past decade, affecting a wide array of investments. Leveraged finance has felt a significant impact because of the growth of private lending and the interconnectedness of public and private lending. Credit markets now face some of the most challenging financial and economic conditions in over a decade. It is likely that transparency and liquidity — two factors that differentiate public and private lending — will be critical to how investors and private equity weather the storm.
Low interest rates have fueled the growth of debt markets, both public and private, over the past decade. This is reflected in the surge of private equity, which has largely fueled the expansion of the leveraged finance (levfin) market across public and private lending. Private equity funds raised $1 trillion of capital in 2022, more than double 2013’s tally of $458 billion, according to Preqin estimates.
Private equity has also fueled the growth of M&A in the large corporate and middle-market segments over the past 20 years. Coupled with the growing size of investments, this has made private equity-sponsored companies more prevalent among the issuers we rate as they have taken on larger and larger investments, utilizing the broadly syndicated loan (BSL) market for funding. Sponsor-driven activity has propelled BSL volume to support M&A and sustained borrower funding needs for dividend recapitalizations and general corporate purposes.
Borrowers and lenders alike face challenging markets and economic headwinds from high inflation, rising interest rates and slowing global growth. These challenges are compounded for private credit investors by the market’s lack of transparency on financial performance and credit risk.
S&P Global Ratings helps in this area by offering insights on private borrowers through public ratings, as well as through credit estimates on private borrowers in middle-market collateralized loan obligations (CLOs) and credit ratings on alternative asset managers and business development companies (BDCs).
Private borrowers with public ratings are an established part of the levfin markets. Most private issuers of BSLs are assigned credit ratings, which provide public indicators of credit health. Currently, companies wholly or partially owned by a financial sponsor make up about half of US and Canadian speculative-grade (rated BB+ or lower) corporate borrowers publicly rated by S&P Global Ratings.
Sponsor-owned companies tend to be at the lower end of the rating scale, in part because our methodology includes the assumption that financial risks for a sponsor-owned company are commensurate with those of highly leveraged companies. In our view, it is not uncommon for private equity investors to extract cash in ways that increase a companies' financial risk, potentially leading to deterioration in credit quality and higher leverage. As a result, the prevalence of private equity-owned companies is more pronounced at the low end of the rating scale. About 75% of borrowers rated B and below (about 50% of all speculative-grade corporate borrowers) are fully or partially private equity owned.
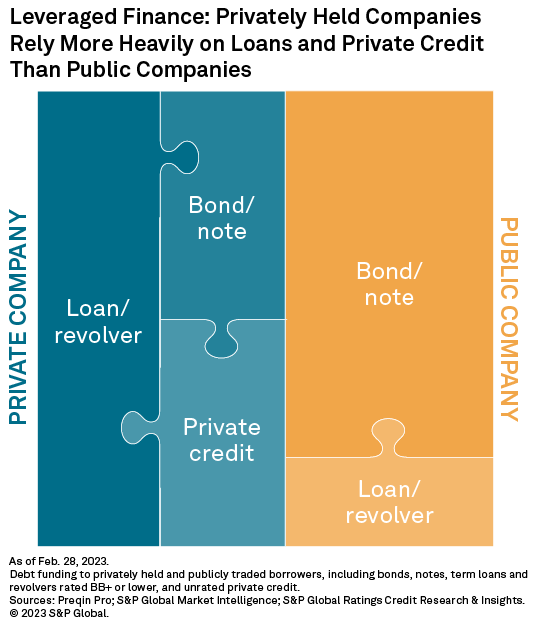
Private borrowers have different debt mixes in their capital structure than public borrowers. They rely on BSLs, revolvers and direct-lending loans, while public companies use BSLs, revolvers, bonds and notes. Even for issuers with public ratings, market transparency varies greatly between public and private borrowers as primary and secondary markets for BSLs and high-yield bonds generate considerable market insights and trading data that offers technical insights.
Private credit markets are structurally different from BSL markets because they are largely unrated and lack transparency on credit risk throughout the life of the deal. There is limited standardization to documentation, which is now prevalent in the BSL market as well.
The lack of a secondary market means the valuation infrastructure for private credit views its risk over a long-term period. Speculative-grade bonds have real-time pricing and trade data widely available. BSLs have readily available, independent mark-to-market pricing. By contrast, private credit is valued using fair value.
As a result of the “buy-and-hold” private credit strategy, reported valuations of private debt were comparatively stable in 2022 despite volatility in publicly traded fixed-income markets being at its highest in more than a decade.
Even with this stability and the continued strength of the direct-lending market, we expect credit conditions to worsen in 2023. Private and public borrowers must contend with higher interest rates, inflation and higher operating costs. A recession and reduced demand could also hurt revenues, earnings, cash flows and companies’ ability to service payments. The impact will be worse if the downturn is deep or protracted.
One advantage for private borrowers entering tougher times is their close working relationship with lenders. Direct lending typically involves one lender per deal or just a small club, in contrast to the dozens found in BSL syndications. Financial maintenance covenants remain common in these deals, and direct lenders have shown a willingness to get involved with sponsors and troubled borrowers to negotiate debt workouts during periods of credit stress.
These relationships helped to minimize traditional payment defaults by private borrowers during the COVID-19 pandemic. Lenders agreed to modified terms of payment and the suspension of covenants in return for sponsors injecting capital and accepting tighter loan documents. However, the recession in 2020 was exceedingly brief. It is difficult to say whether there would be similar behavior during a protracted downturn in which more distressed entities needed rescue.
Furthermore, some direct lenders could face concentration and vintage risk as they have been easing lending standards, increasing loan sizes and relaxing covenants for years. While these lenders may have recently adopted a more defensive posture to reduce risk in current deals, stricter lending standards could hamper the availability of private credit more broadly, potentially cutting off a critical source of funding for some borrowers.
Private credit has multiple sources of funding, including private credit funds and publicly traded funds, such as BDCs and interval funds. For the private debt market, middle-market CLOs (MM CLOs) are an important source of funding. Unlike BSL CLOs, which are collateralized by rated loans, MM CLOs are vehicles backed by loans made mostly to unrated middle-market companies. The number of US MM CLOs has expanded in recent years. A total of 156 were launched between 2018 and 2022, versus 84 between 2013 and 2017. S&P Global Ratings rated 117 MM CLOs in 2018-2022.
In rating an MM CLO, S&P Global Ratings produces credit opinions on many of the underlying companies through our credit estimates scores. Credit Estimates involve a review of a company’s audited financial statements, covenant-compliance certificates and credit agreements. The analysis borrows heavily from S&P Global Ratings’ corporate ratings framework. In a few instances, we also perform Credit Estimates outside the context of MM CLOs.
The median EBITDA for companies with credit estimates in 2022 was about $25 million. That is smaller than the typical middle-market threshold of about $50 million EBITDA. Many of the assessed companies were local or regional players with limited pricing power, narrow product or service offerings and high leverage. These companies are therefore more vulnerable to economic or financial downturns than larger counterparts in the levfin market.
S&P Global Ratings had more than 2,100 outstanding Credit Estimates in North America by the end of 2022. These borrowers had $60 billion of unrated loans held by CLOs rated by S&P Global Ratings in the fourth quarter of 2022. About $300 billion more of these borrowers’ loans were held elsewhere, likely in other private credit funds and BDCs.
It should be noted that MM CLO managers select the borrowers for Credit Estimates. This means they likely represent stronger-than-average credit quality. Still, Credit Estimates provide a window into an area of the private credit market that otherwise lacks transparency.
Most of the private debt borrowers for which we have Credit Estimates are backed by private equity, which means the financial risks are similar to those for highly leveraged companies. Therefore, about 75% of companies with Credit Estimates have a score of “b-” and about 10% are in the “ccc” range. By contrast, only 36% of rated corporate issuers in North America are at B- or lower rating levels.
Software services and healthcare are the sectors most represented by Credit Estimates, accounting for about 25% of aggregate credit-estimated debt held in CLOs. Both of these sectors appear vulnerable to current economic and credit conditions.
Software has the second-highest leverage, at 7.8x, and the second-lowest cash interest coverage, at 1.4x, among sectors most widely represented within Credit Estimates. S&P Global Ratings adjusts company-provided financials based on our methodology. For instance, acquisition and restructuring expenses are treated as operating costs, which may reduce EBITDA. Potential synergies or cost savings are also mostly ignored. Both adjustments would likely lower our view of credit metrics.
The healthcare services sector was challenged by a significant shortage of experienced medical staff. The surge pricing for traveling and temporary nurses has posed constraints for providers to staff at capacity. Reimbursements and rising labor costs place other pressures on this sector.
The sectors most sensitive to inflation include consumer discretionary products and retail. Middle-market companies typically do not have strong brand followings and may not be able to pass on additional costs to consumers to preserve profit margins. As consumer spending on goods declines, the retail and consumer discretionary sectors continue to see stress. The EBITDA margin for middle-market household durables declined to 14.6% last year from 19.6% in 2021. The margin for beverages declined to 20% from 30%.
While Credit Estimates provide granular insights into the credit of private borrowers, our ratings on alternative asset managers offer views on the credit quality of some of the largest participants in the private credit market.
The growing alternative asset class has fueled the growth of private credit. Six of the largest alternative asset managers we rate (Apollo Asset Management Inc., Ares Management Corp., Blackstone Inc., Brookfield Asset Management Inc., The Carlyle Group and KKR & Co.) have roughly doubled assets under management devoted to credit since the end of 2019, reaching approximately $1.4 trillion.
That boom supported our ratings on these alternative managers because it added diversity to their businesses and revenues. Investors also bear the risk of assets in funds and BDCs. Still, a significant deterioration in asset quality could tax a fund manager’s ability to deal with problem credits, pose reputational risks and even create liquidity challenges under certain circumstances. Given these vehicles’ rapid growth, we expect to see a meaningful rise in credit losses, particularly if economic conditions worsen.
These private credit funds provide a source of private debt that has grown to be comparable in size to BSL and high-yield markets in the US. The private credit assets of these six alternative asset managers compare to the $1.4 trillion BSL market, the $1.5 trillion speculative-grade bond market and the roughly $5 trillion of commercial and commercial real estate loans on the balance sheets of Federal Deposit Insurance Corp.-insured banks. (Those estimated sizes are based on data from the FDIC and Leveraged Commentary and Data from PitchBook, a Morningstar company.)
Alternative asset managers operate private credit funds, BDCs, interval funds and MM CLOs that can fund direct lending. The ability of these managers to allocate credit across their platforms has allowed them to underwrite larger private loans.
Based on the limited disclosures available, these private credit vehicles also hold some publicly traded debt, such as BSLs, speculative-grade bonds, junior or equity tranches of structured products and even some investment-grade debt. As for much of the private markets, the line between a public or private asset can blur.
Alternative asset managers have expanded their ability to offer direct lending by forming BDCs. The number of BDCs outside of large asset managers has also grown in recent years.
There are now almost 130 BDCs, and we believe that they have invested a total of almost $270 billion. We rate a small minority of BDCs, and these tend to be among the largest and most established. While we rate about a dozen BDCs, their investments approach $130 billion (as of the third quarter of 2022), which is nearly half the industry total. The rated BDCs’ investments have more than doubled from under $50 billion in 2019.
All but one of the BDCs we rate are rated BBB-, even with the higher-risk nature of their assets. Credit quality for most of the BDCs we rate is supported in large part by low leverage, diversified funding mixes, limited loss experience and affiliations with broader asset managers.
Analyzing BDCs’ financial statements and filings offers a glimpse into middle-market credit trends because these vehicles are more transparent funds. Middle-market borrowers likely account for a substantial portion of leveraged loans and other investments at many funds and BDCs.
A clear trend among the rated BDCs is a jump in their borrowers’ weighted average EBITDA in 2022 [see chart]. This reflects how direct lenders have increasingly competed for larger corporate borrowers. Strong fundraising and capital raising have helped direct lenders push into this area, along with their ability to deploy large investments, with some loans exceeding $2 billion. With financing conditions for the BSL and speculative-grade bond markets constrained by rising rates and economic uncertainties, direct lenders are finding more opportunities to lend to larger companies. This trend is reflected among the BDCs we rate; the weighted average EBITDA of several BDCs’ portfolio companies notably increased in 2022.
The yield on BDC portfolio assets held relatively flat despite growing portfolios until around 2020. With the low rates and the shift to larger borrowers in 2020 and 2021, portfolio asset yields dipped below 8%. However, these yields rebounded above 10.2% last year, reflecting the higher benchmark yields of the London interbank offered rate and the secured overnight financing rate as well as a likely increase in risk. In comparison, commercial and industrial loans in aggregate on the balance sheets of FDIC-insured banks yielded less than 6% in the fourth quarter of 2022.
We believe that a portion of BDC portfolio companies have suffered a deterioration in leverage and interest coverage. The asset-quality risk of many private credit assets is also meaningfully higher than what banks typically carry on their balance sheets.
Another sign of material asset-quality risk at some funds and BDCs is exposure to payment-in-kind (PIK) loans. PIK loans allow borrowers to make payments with additional debt or equity rather than cash. Some BDCs intentionally structure their investments to be PIKs for the first few years. Still, we have seen an uptick in PIK income as a percentage of gross investment income, partially because lenders have amended terms with borrowers. For some BDCs, the portion of investments making PIK payments was 10%-20% in the third quarter of 2022.
Permanent capital, long-term funds, limited reliance on short-term funding and low leverage generally help private credit funds and BDCs protect against market and liquidity risks. However, in some scenarios, private credit funds and BDCs could face pressures, particularly regarding liquidity.
Private credit funds and BDCs may make distributions and redeem some of their shares. Investors may have rights to request those distributions, but such distributions are usually not guaranteed. Fund managers intend to support distributions and share redemptions with liquidity on hand, cash flows from their investments, borrowings or assets sales. However, challenges can arise when the demand for outflows surges.
For example, in December 2022, Blackstone had two funds that faced a spike in redemption requests. The private credit fund BCRED received requests totaling about 5% of its outstanding shares, around its annual 5% limit on share repurchases. Blackstone’s real estate investment trust fund also reached its redemption limit around the same time. In the case of BCRED, Blackstone said it had ample liquidity to honor the requests it received, but the REIT limited withdrawals.
In down markets, any number of situations, including investor panic, could lead to a surge in redemption requests. Some private funds and private BDCs, looking to honor requests, might sell assets, driving down the value of investments in the market.
In addition to redemption requests, private credit funds and BDCs could face claims on liquidity from their own lenders and debtholders when they employ leverage. Liquidity risk can arise for BDCs if a decline in the value of their assets jeopardizes their compliance with their asset coverage requirements. Such a violation can also trigger a violation of covenants on facilities that banks or other lenders typically extend to them. Those violations may force a BDC to repay all or part of its funding facilities, which may force it to sell assets (see "Business Development Companies' Asset Coverage Ratios Could Feel The Strain Of A Weakening Economy," Oct. 20, 2022).
Public and private credit borrowers are both subject to today’s market challenges, particularly the headwinds of unrelenting inflation and rising costs of funding. Publicly rated credits have remained stalwart over the past year, but the factors that have steadied borrowers — strong cash balances, long-dated maturity walls and a resilient consumer base — are starting to erode.
Private credit is likely feeling a similar pinch, given the increasing share of PIKs among BDC assets and steady declines in fair valuations. The pressures on traditional direct lending must also be significant as margins are thinner and leverage is higher. In addition, the investment strategy in direct lending has been very focused on total return over positive cash flow in the past decade. The headwinds of reduced profitability and higher cost of funding may blow over more borrowers than in large corporates.
We may also be looking at a red sky at night. Private equity’s enormous arsenal of dry powder does mean there is significant capital to deploy in the right conditions — both par and special situations. Unlike the BSL and high-yield markets, which are more dependent on “in the moment” liquidity from investors, private capital is ready to provide funding if the moment is right. In addition, the strong working relationships between borrowers and lenders are likely very advantageous in these challenging market conditions, while the continued presence of covenants helps to manage risks.
In 2022, private credit was instrumental in keeping the complete ecosystem of credit flowing: public and private, large corporate and middle-market. It is entirely possible that it will remain the anchor of credit markets until public markets normalize and return to full strength. Still, the question is less about private equity being able to extend credit, and more about its willingness to do so.
This article was authored by a cross-section of representatives from S&P Global and in certain circumstances external guest authors. The views expressed are those of the authors and do not necessarily reflect the views or positions of any entities they represent and are not necessarily reflected in the products and services those entities offer. This research is a publication of S&P Global and does not comment on current or future credit ratings or credit rating methodologies.

