Editor's note: This report was updated on November 14, 2023, to add clarifications related to the USDC depegging event in March.
Published: September 7, 2023
Stablecoins aim to maintain a pegged value, but the stability of each stablecoin differs based on the type of collateral it is backed by, or lack thereof.
Stablecoins are not risk-free and are subject to market volatility, market confidence and adoption, technology risk, demand and supply, and market liquidity.
Deviation from the pegged value is one of the most significant risks for stablecoins. For the five stablecoins studied, depeg events where the value falls below $1 appear to be more frequent and to last longer than those where their value increases to above $1.
For a couple of these stablecoins, excluding weekends almost halves their volatility. This may be related to the fact that they rely on traditional payment rails that operate only during normal banking hours.
The level of transparency on stabilization mechanisms and redemption routes influences market prices.
Blockchain technology promises 24/7, borderless and fast payment capabilities, but transactions require the use of programmable digital tokens. Cryptocurrencies such as bitcoin and ether are speculative assets with no underlying stabilization mechanism, meaning they are highly volatile and impractical for use in many financial applications.
Stablecoins address the need for digital tokens that maintain a consistent value relative to a reference asset such as fiat currency (for example, US dollar). Stablecoins play an essential role in decentralized finance (DeFi) protocols, acting as a medium of exchange between other cryptocurrencies. They allow users to borrow against other crypto-assets, to hedge against a long position, to create a short position or to take out a personal loan with an asset with stability closer to a strong fiat currency.
Stablecoin performance varies significantly and is dependent on the type of collateral it is backed by, or indeed the lack of backing collateral. Stablecoins can be fully or partly collateralized by real-world assets, by fiat currencies, by crypto-assets, or they can be noncollateralized and purely algorithmic.
The price of algorithmic stablecoins is controlled by smart contracts that manage interest rates or the supply of an endogenous token. To date, these stablecoins have not scaled successfully and have experienced sudden collapses, such as that of Terra’s UST stablecoin in May 2022.
This article analyzes five stablecoins that account for more than 90% of the $125 billion market cap as of June 2023, all of which are pegged to the US dollar ($1). We studied their performance over a 24-month period ending mid-June 2023.
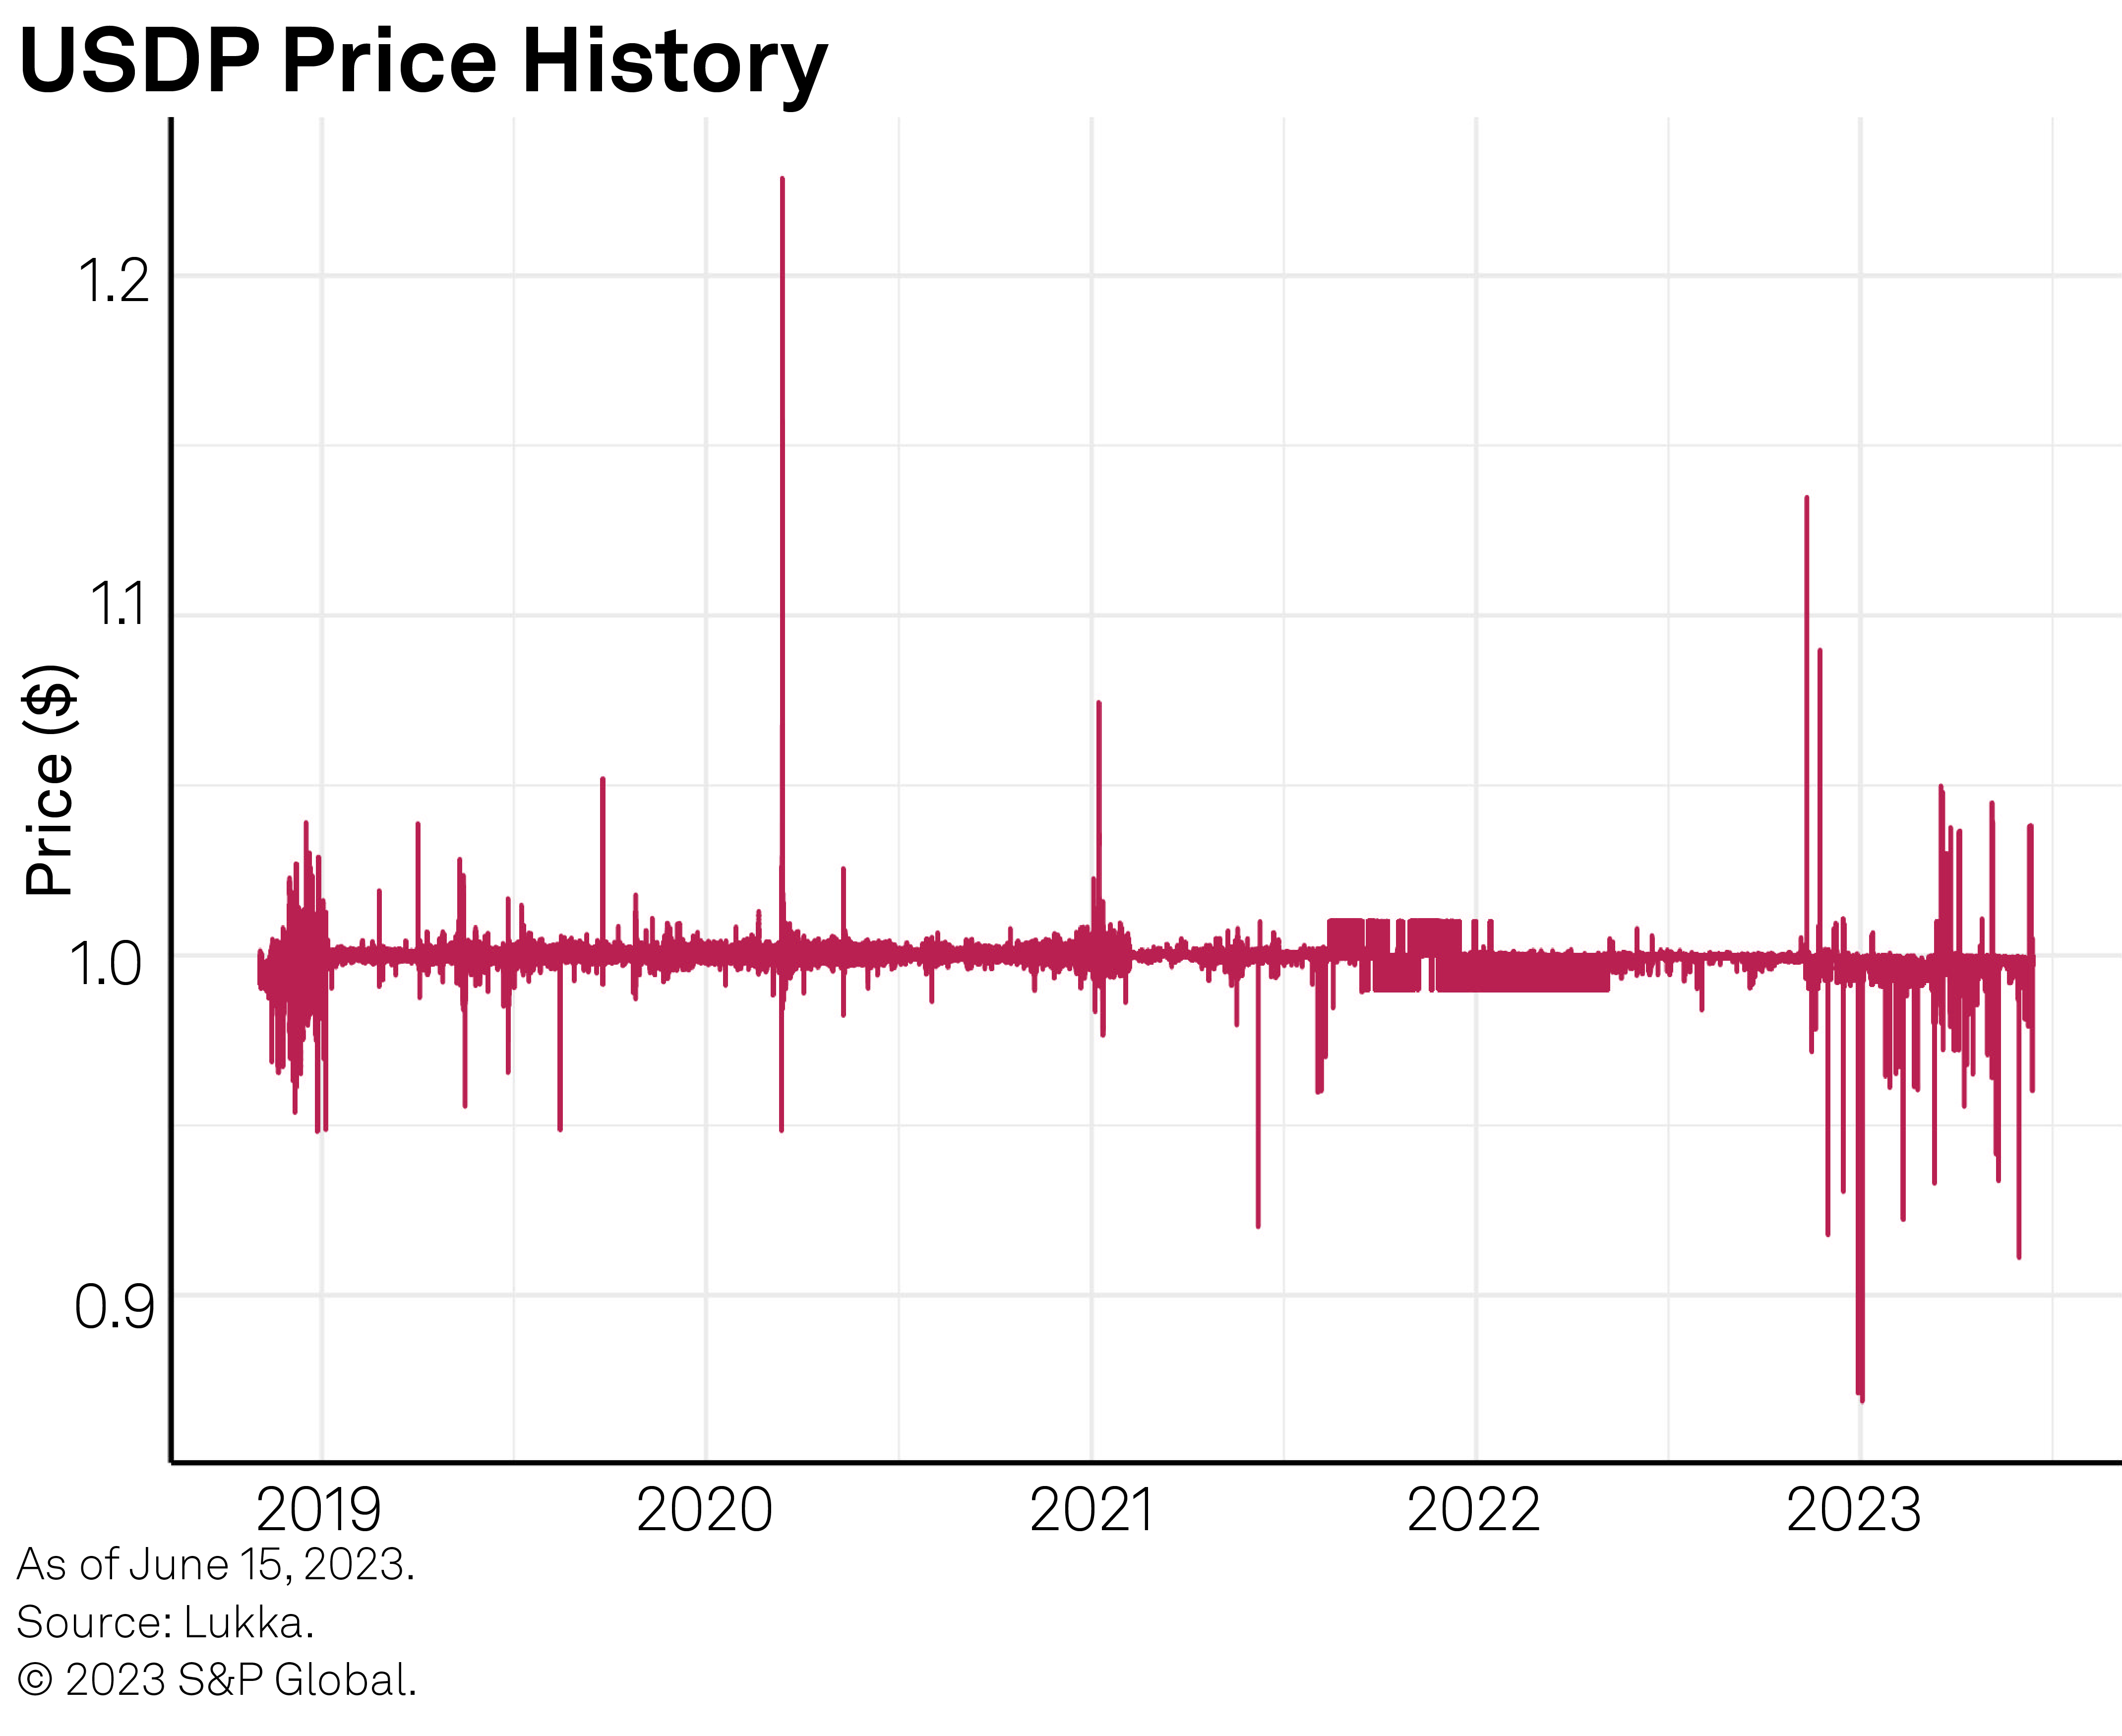
Figures 26 through 30 in the appendix show the price of each of these stablecoins since inception.
The stablecoins covered by this study are:
– Tether (USDT): USDT is the largest stablecoin by market capitalization ($83 billion) and is pegged to the US dollar. It is a centralized, real-world assets (RWA) collateralized stablecoin, meaning that each token is backed by $1 in reserve assets (which include cash and cash equivalents, US Treasuries, money market funds, bitcoin, gold and other financial assets).
– USD Coin (USDC): USDC is the second-largest stablecoin ($28 billion market cap). USDC is a centralized, RWA-collateralized stablecoin, meaning that each token is backed by $1 in reserve assets. Its reserves are held exclusively in US banks as cash and short-term US Treasuries.
– Multi-Collateral Dai (DAI): DAI ($4.7 billion market cap) is a decentralized cryptocurrency pegged to the US dollar produced by the Maker protocol, managed by a decentralized autonomous organization (DAO), MakerDAO. The Maker protocol allows users to take out overcollateralized loans denominated in DAI. Previously, loans were collateralized primarily by othercryptocurrencies but now include other stablecoins (such as USDC) and real-world assets including US Treasuries. The protocol aims to maintain the value of DAI close to $1 using smart contracts to adjust the loans’ borrowing and collateral’s saving interest rates to manage demand and supply. It also uses a “peg stability module” that acts as a market maker between DAI and other stablecoins.
– Binance USD (BUSD): BUSD is a centralized, RWA-collateralized stablecoin managed by Binance, with a $4.1 billion market cap.1 The coin was minted by Paxos Trust, which, in February 2023, stopped minting new BUSD following regulatory action. It is backed by cash reserves and cash equivalents (including short-term US Treasuries).
– USDP Dollar (USDP): USDP is a centralized, RWA-collateralized stablecoin with a $990 million marketcap.2 It is collateralized by cash and cash equivalents (including short-term US Treasuries) held in Paxos-owned US bank accounts.
These five stablecoins have been relatively successful at maintaining a value close to their peg over their limited history. They are subject to market fluctuations and can and do deviate from the pegged value from time to time. Reasons for this include concerns relating to the underlying reserve assets, changing market conditions, technological issues, liquidity stresses or changes in regulations.
1 As of August 2023, market cap for BUSD was $3.3 billion.
2 As of August 2023, market cap for USDP was $505 million.
– The failure of three US banks — Silicon Valley Bank (SVB), Signature Bank and Silvergate Bank — caused both USDC and DAI to depeg.
– USDC depegged by 13% below $1 after its issuer, Circle, confirmed that $3.3 billion of cash reserves backing USDC were held at SVB. Circle also relied partly on Signature Bank and Silvergate Bank to operate redemptions between USDC and fiat US dollars.
– DAI’s value closely tracked that of USDC because at the time USDC holdings and related instruments represented over half of the collateral reserves backing DAI.
– Both stablecoins recovered to their peg levels after the Federal Reserve confirmed that it would support the banks’ creditors.
– Both stablecoins also subsequently adjusted the composition of their reserves. The cash portion of USDC’s reserves is primarily held at Bank of New York Mellon, which is also the primary custodian for the reserve assets for USDC. DAI’s reserves diversified away from USDC across multiple stablecoins and significantly increased the share of real-world assets.
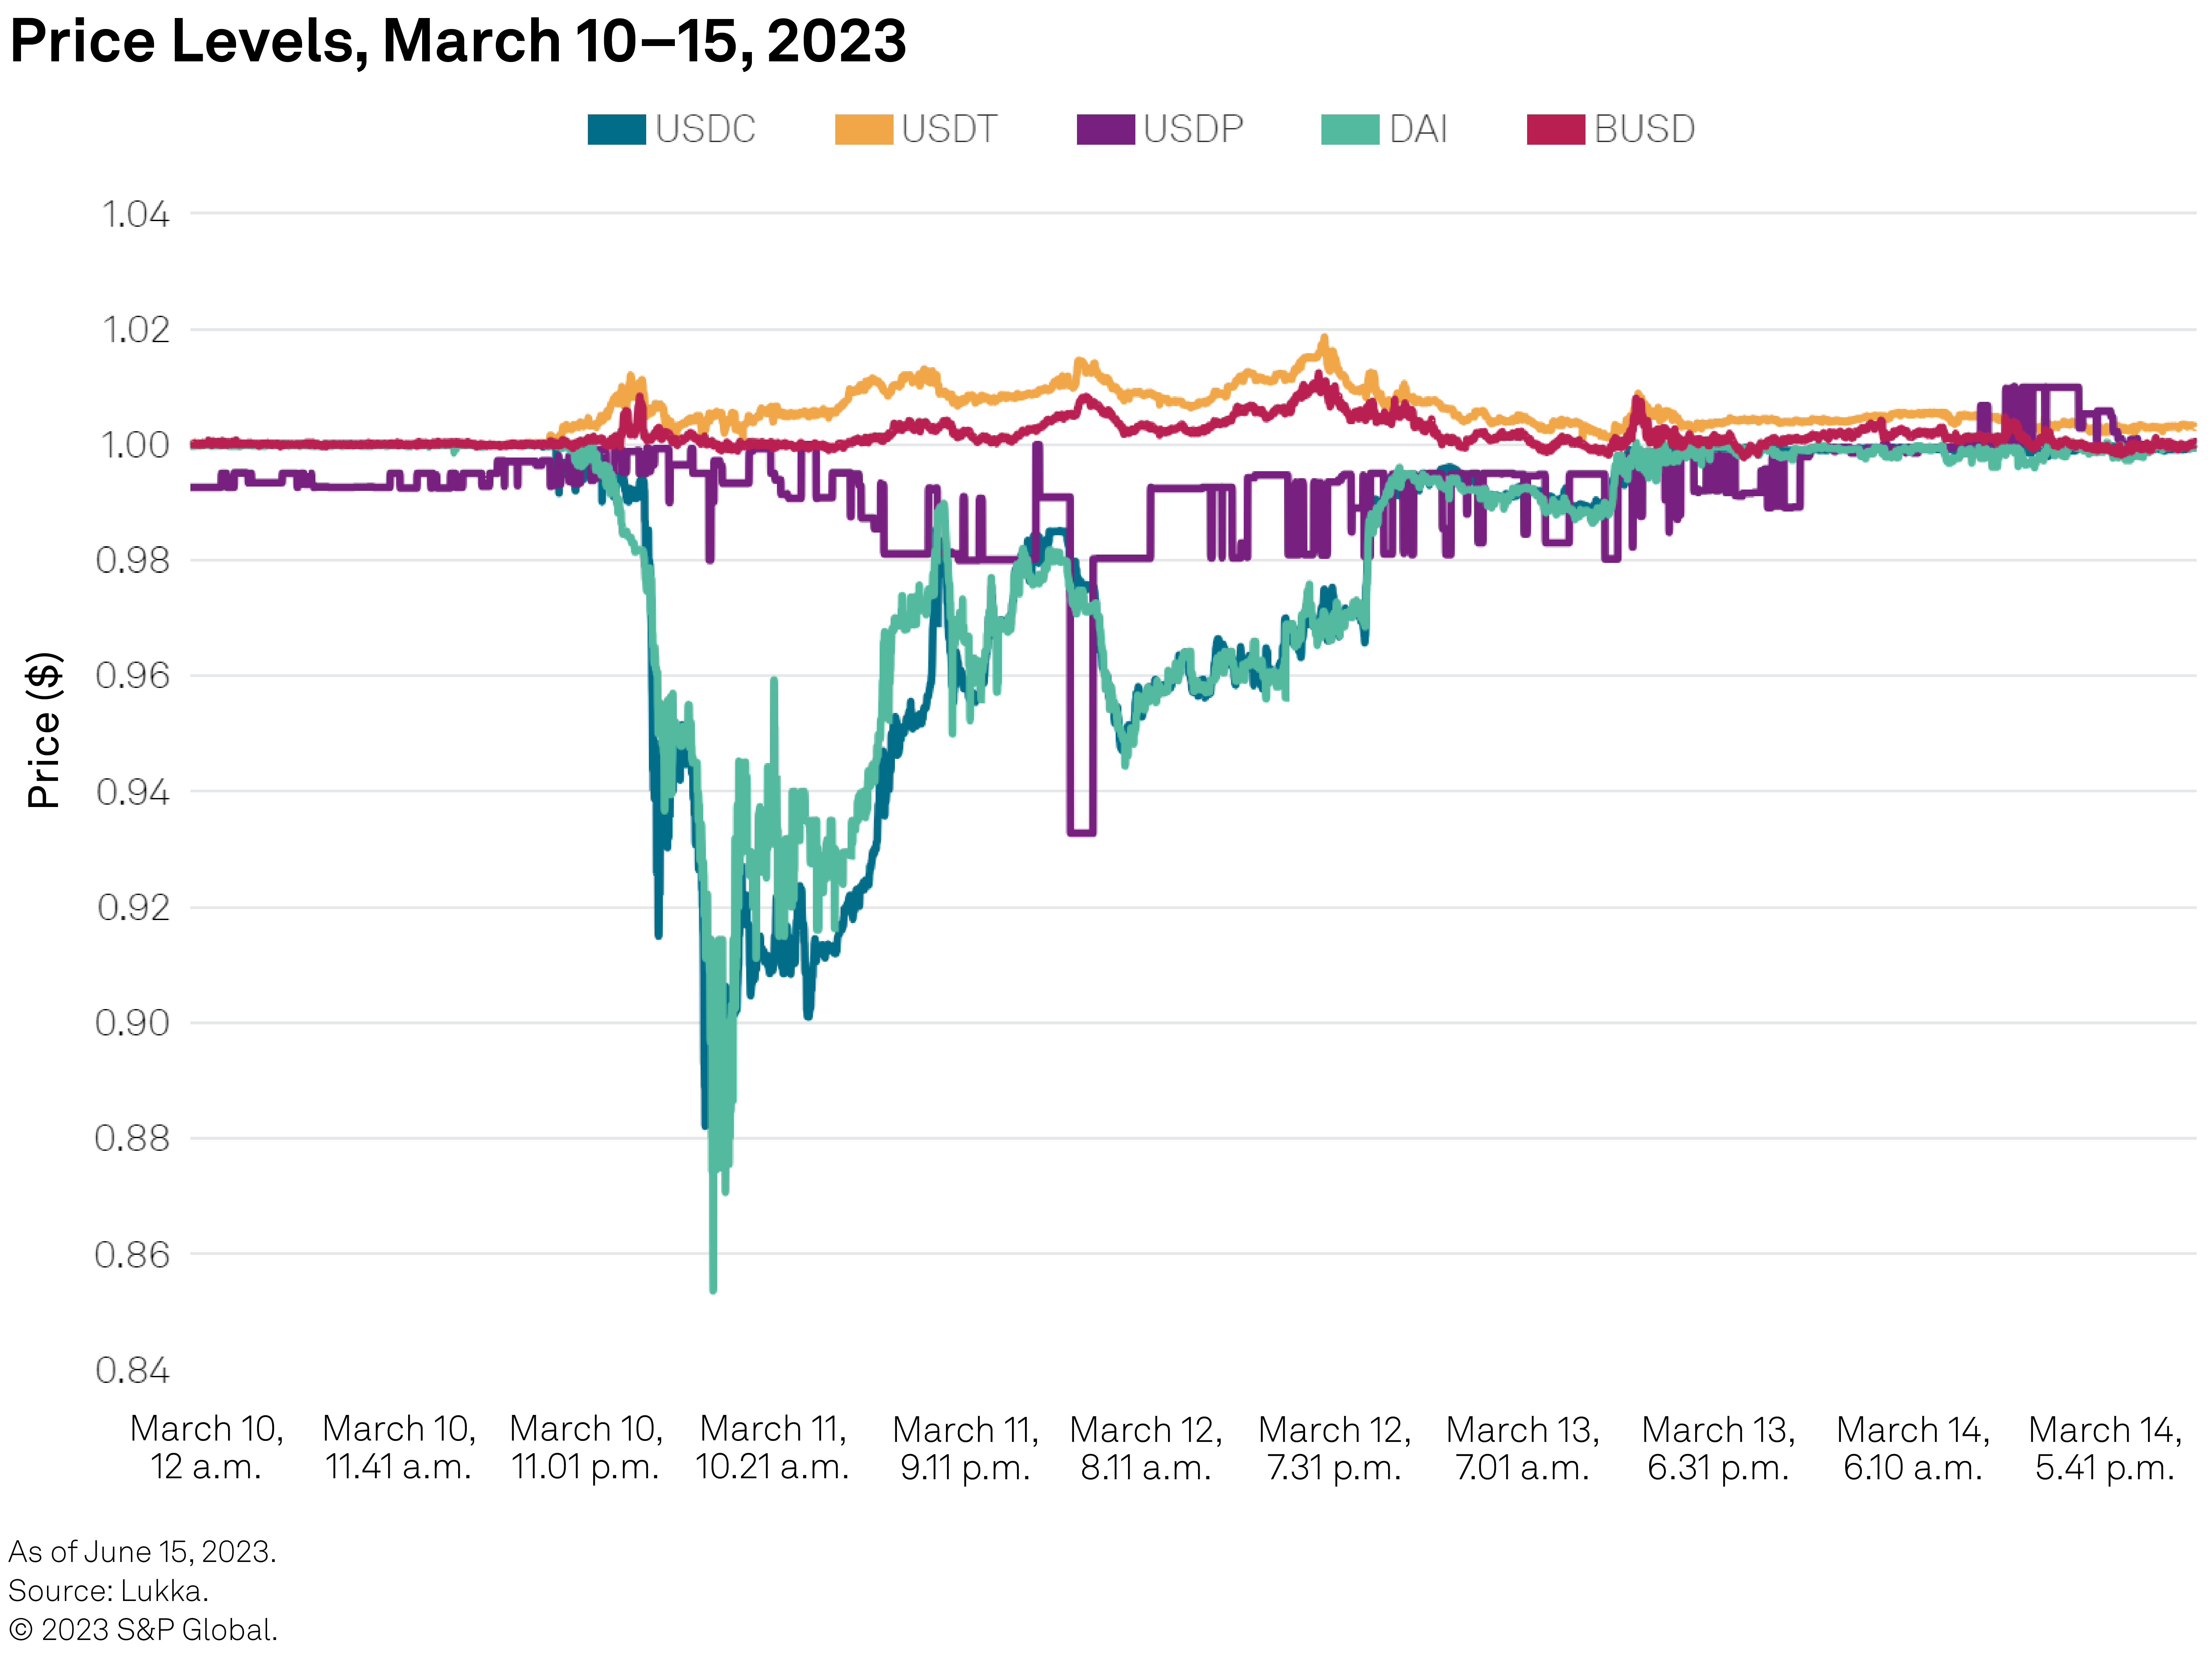
– Not all stablecoins were affected in the same way. Tether, for example, had no exposure to SVB; its value increased slightly above $1 as market participants rotated out of the affected stablecoins, before returning to parity. Figure 1 shows the prices of the stablecoins over that weekend.
Figure 1
We then looked at the market capitalization for the five studied stablecoins before and after the March 2023 depegging event. Figure 2 shows a snapshot of the market capitalization for two dates, one year apart, in June 2022 and June 2023. USDT and USDC far exceed the market cap of other stablecoins, despite USDC’s market cap almost halving post-SVB’s collapse.
For historical perspective, we then looked at the market capitalization over a 12-month period. Figure 3 shows the historical market cap for the five coins over a 12-month period (June 2022–June 2023). Circulating supply of some stablecoins, including USDC, dropped after March 2023, and market capitalization halved in the months following the SVB event.
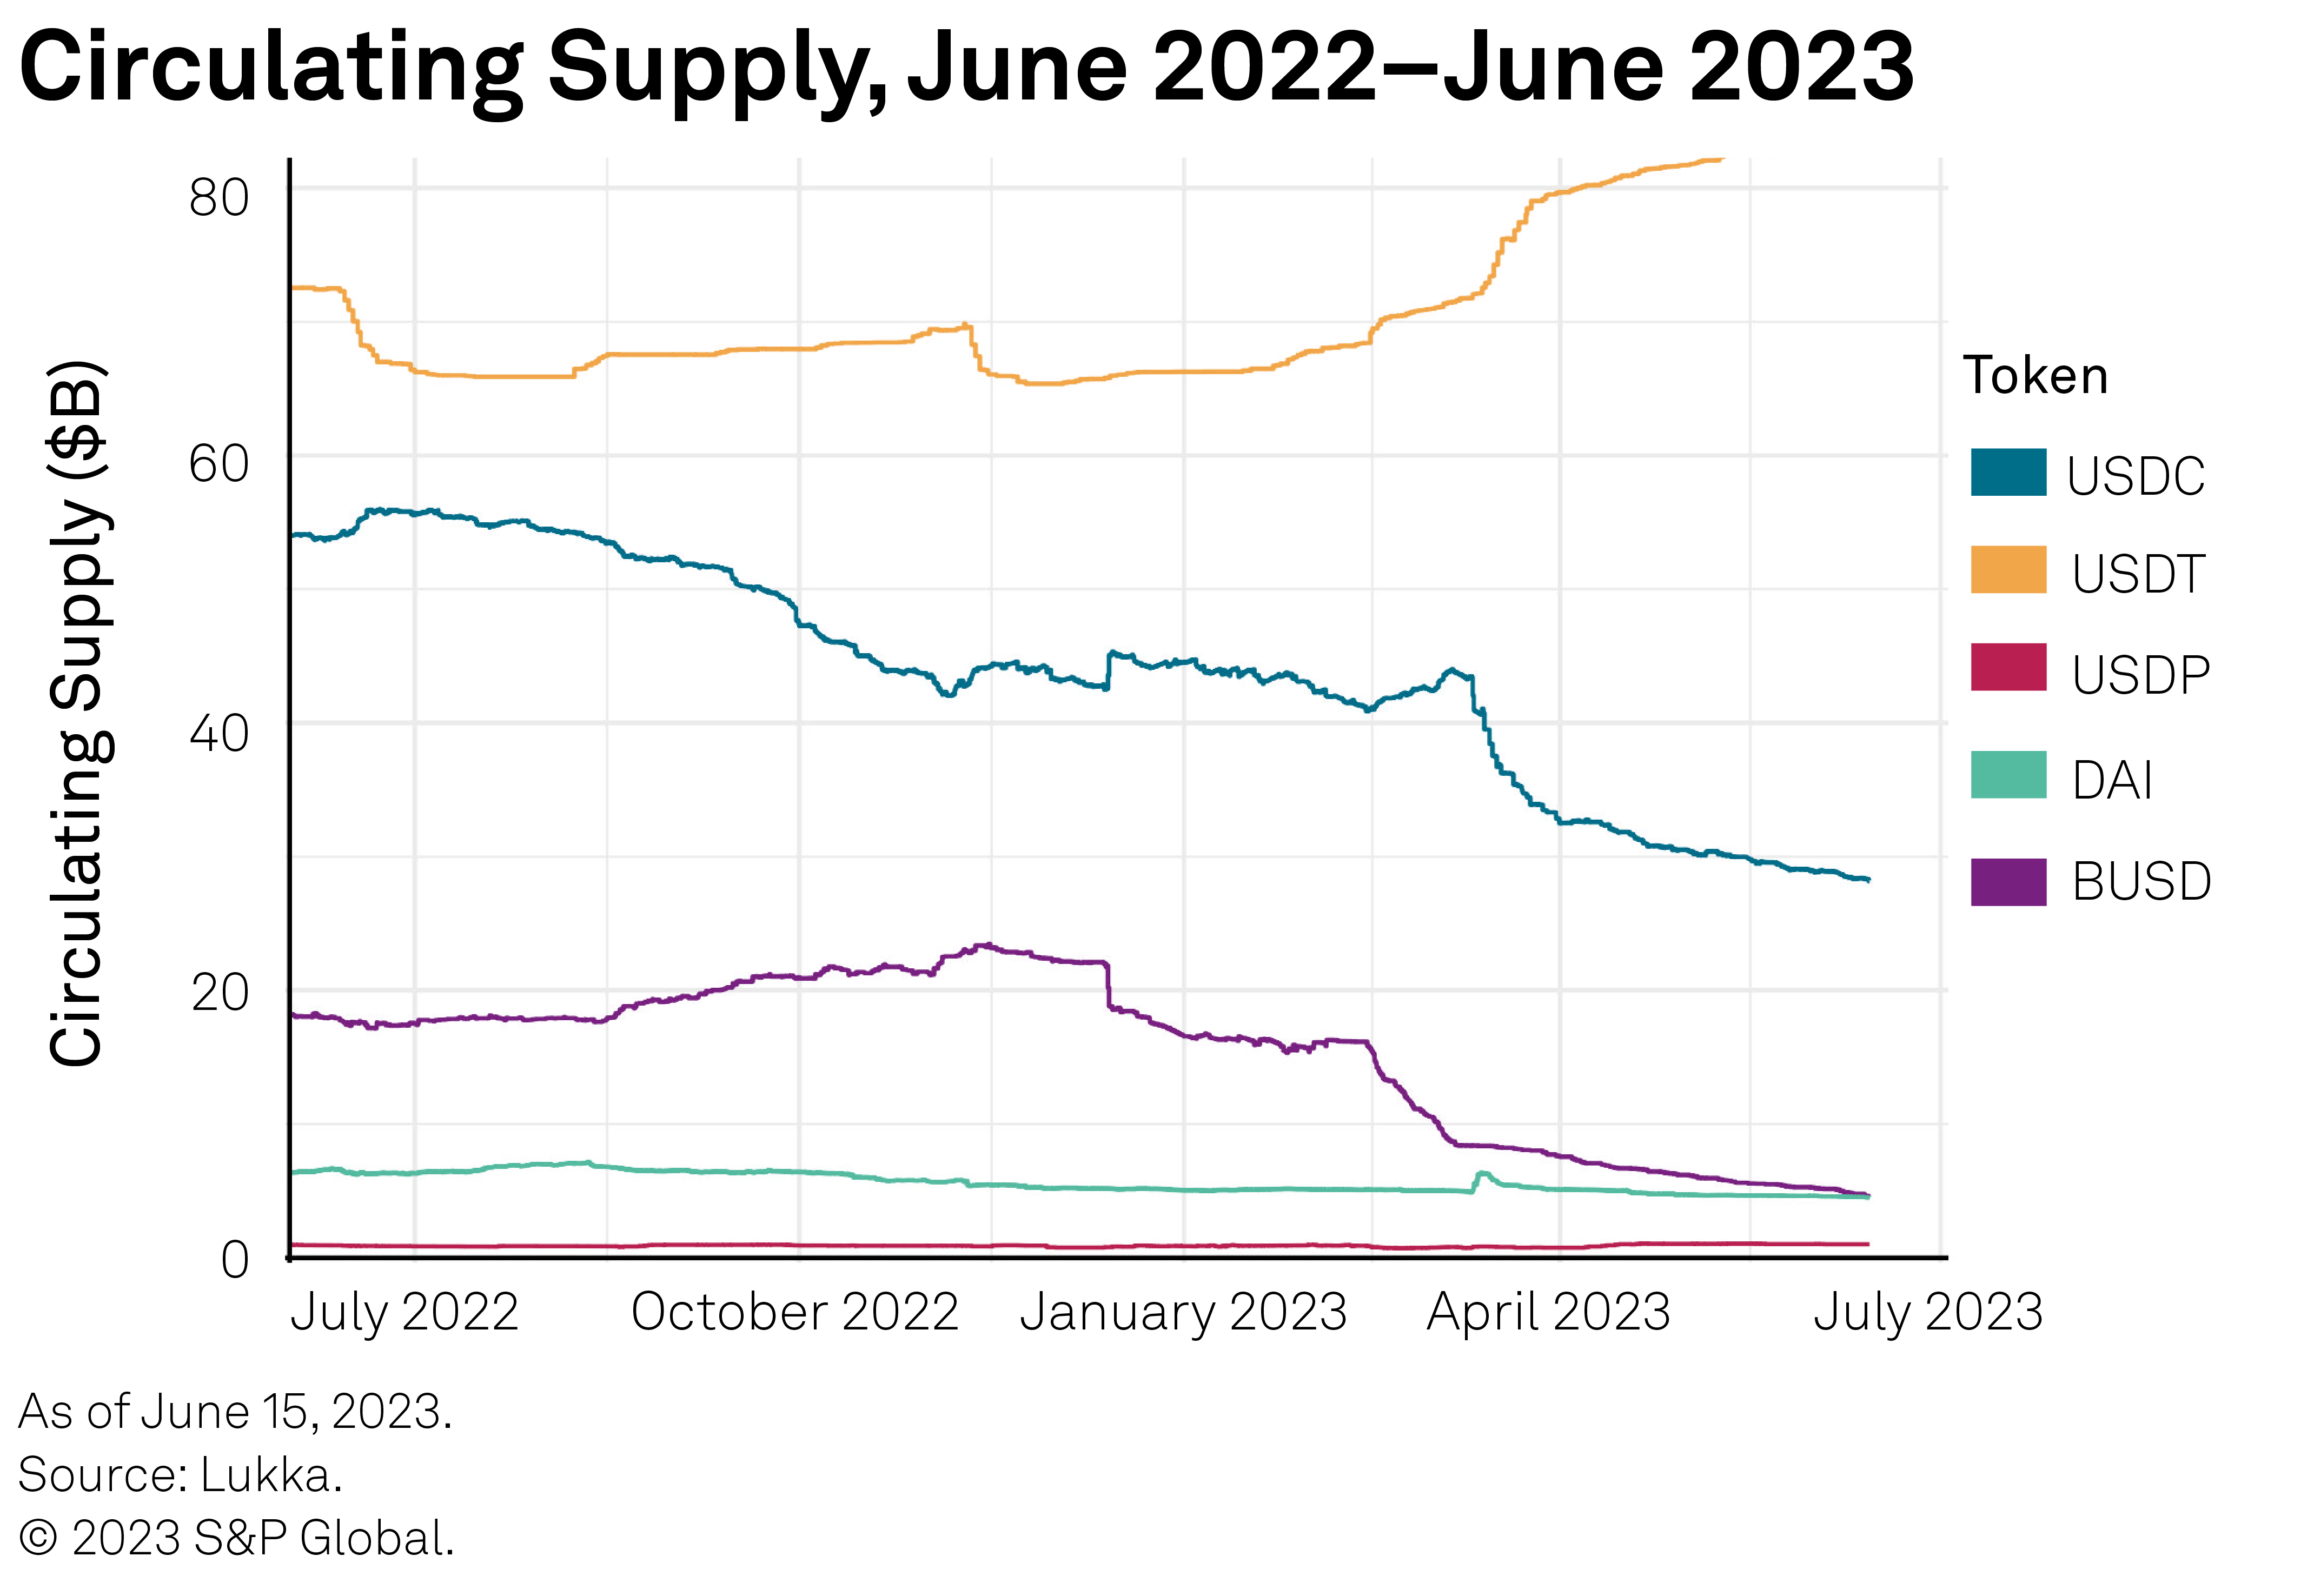
Figure 4 shows the circulating supply data over the same 12-month period.
Figure 2
Figure 3
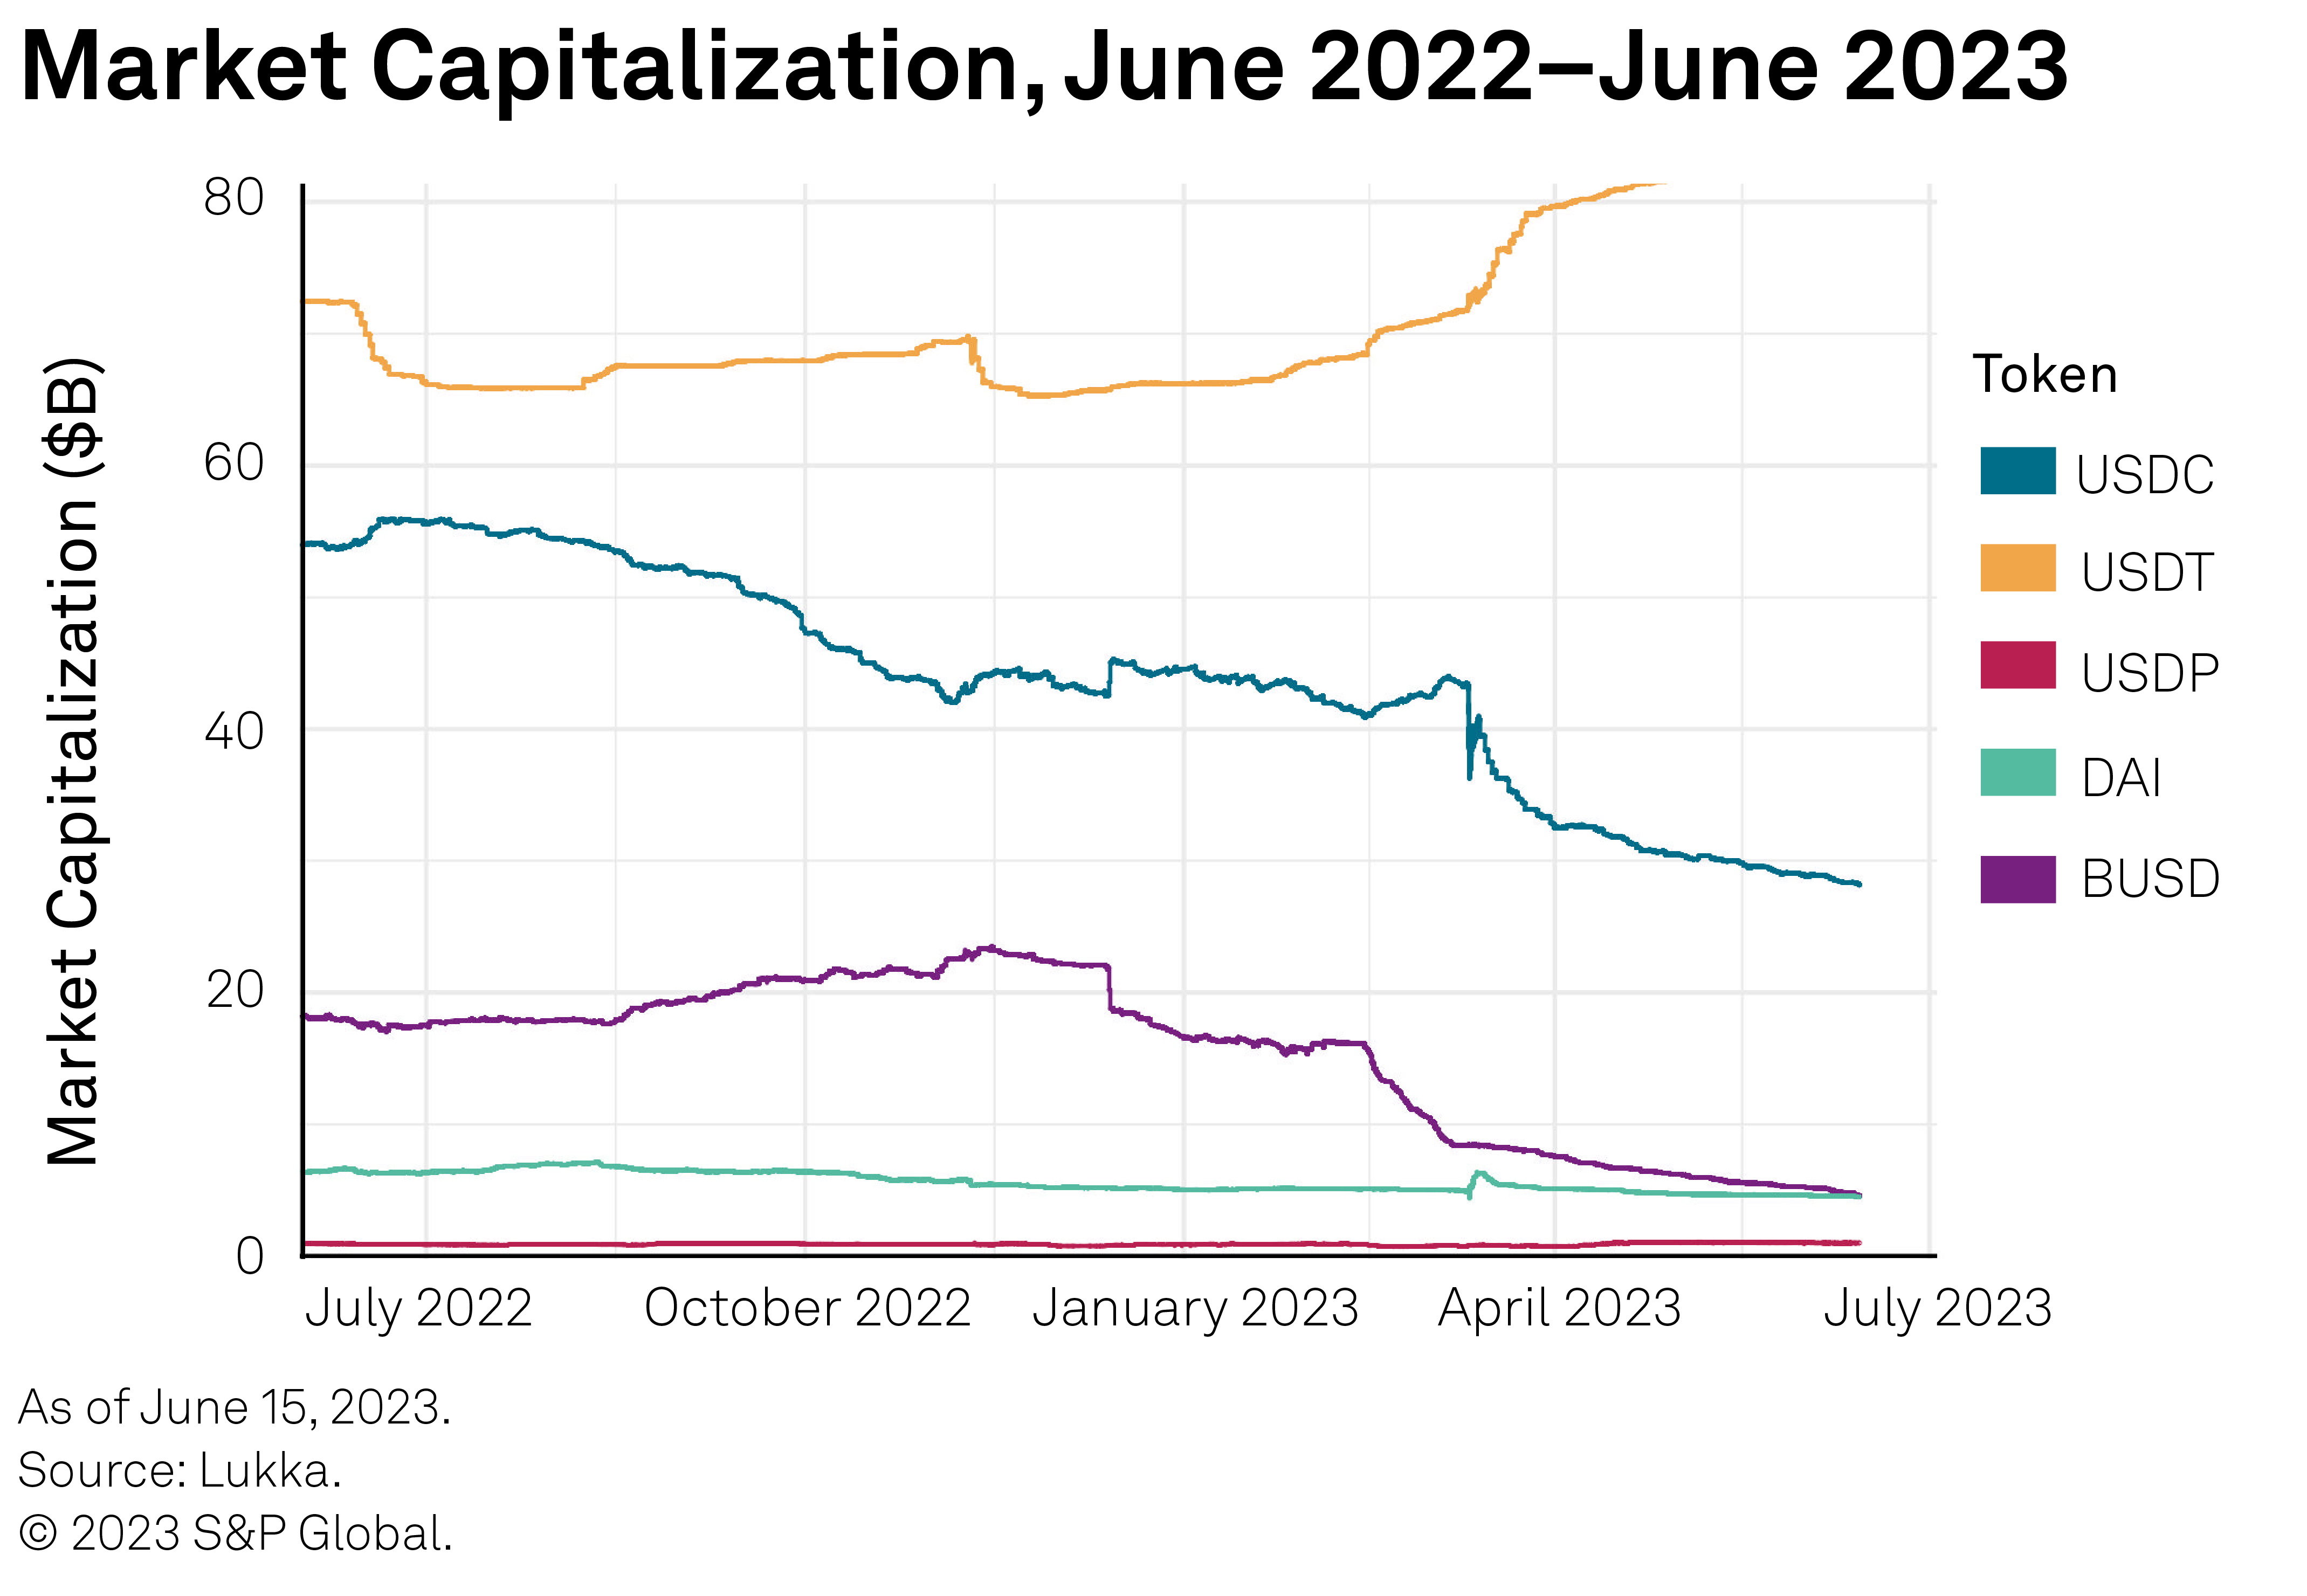
Figure 4
Deviation from the pegged value is one of the most significant risks for stablecoins. Figure 5 shows the most common factors that cause depeg events. A deviation above or below the pegged value can cause a loss to the buy side or the sell side. Not all stablecoins are susceptible to the same degree to depegging, because their underlying collateral and governance of reserves differ.
Figure 5
Understanding Root Causes for Depeg Events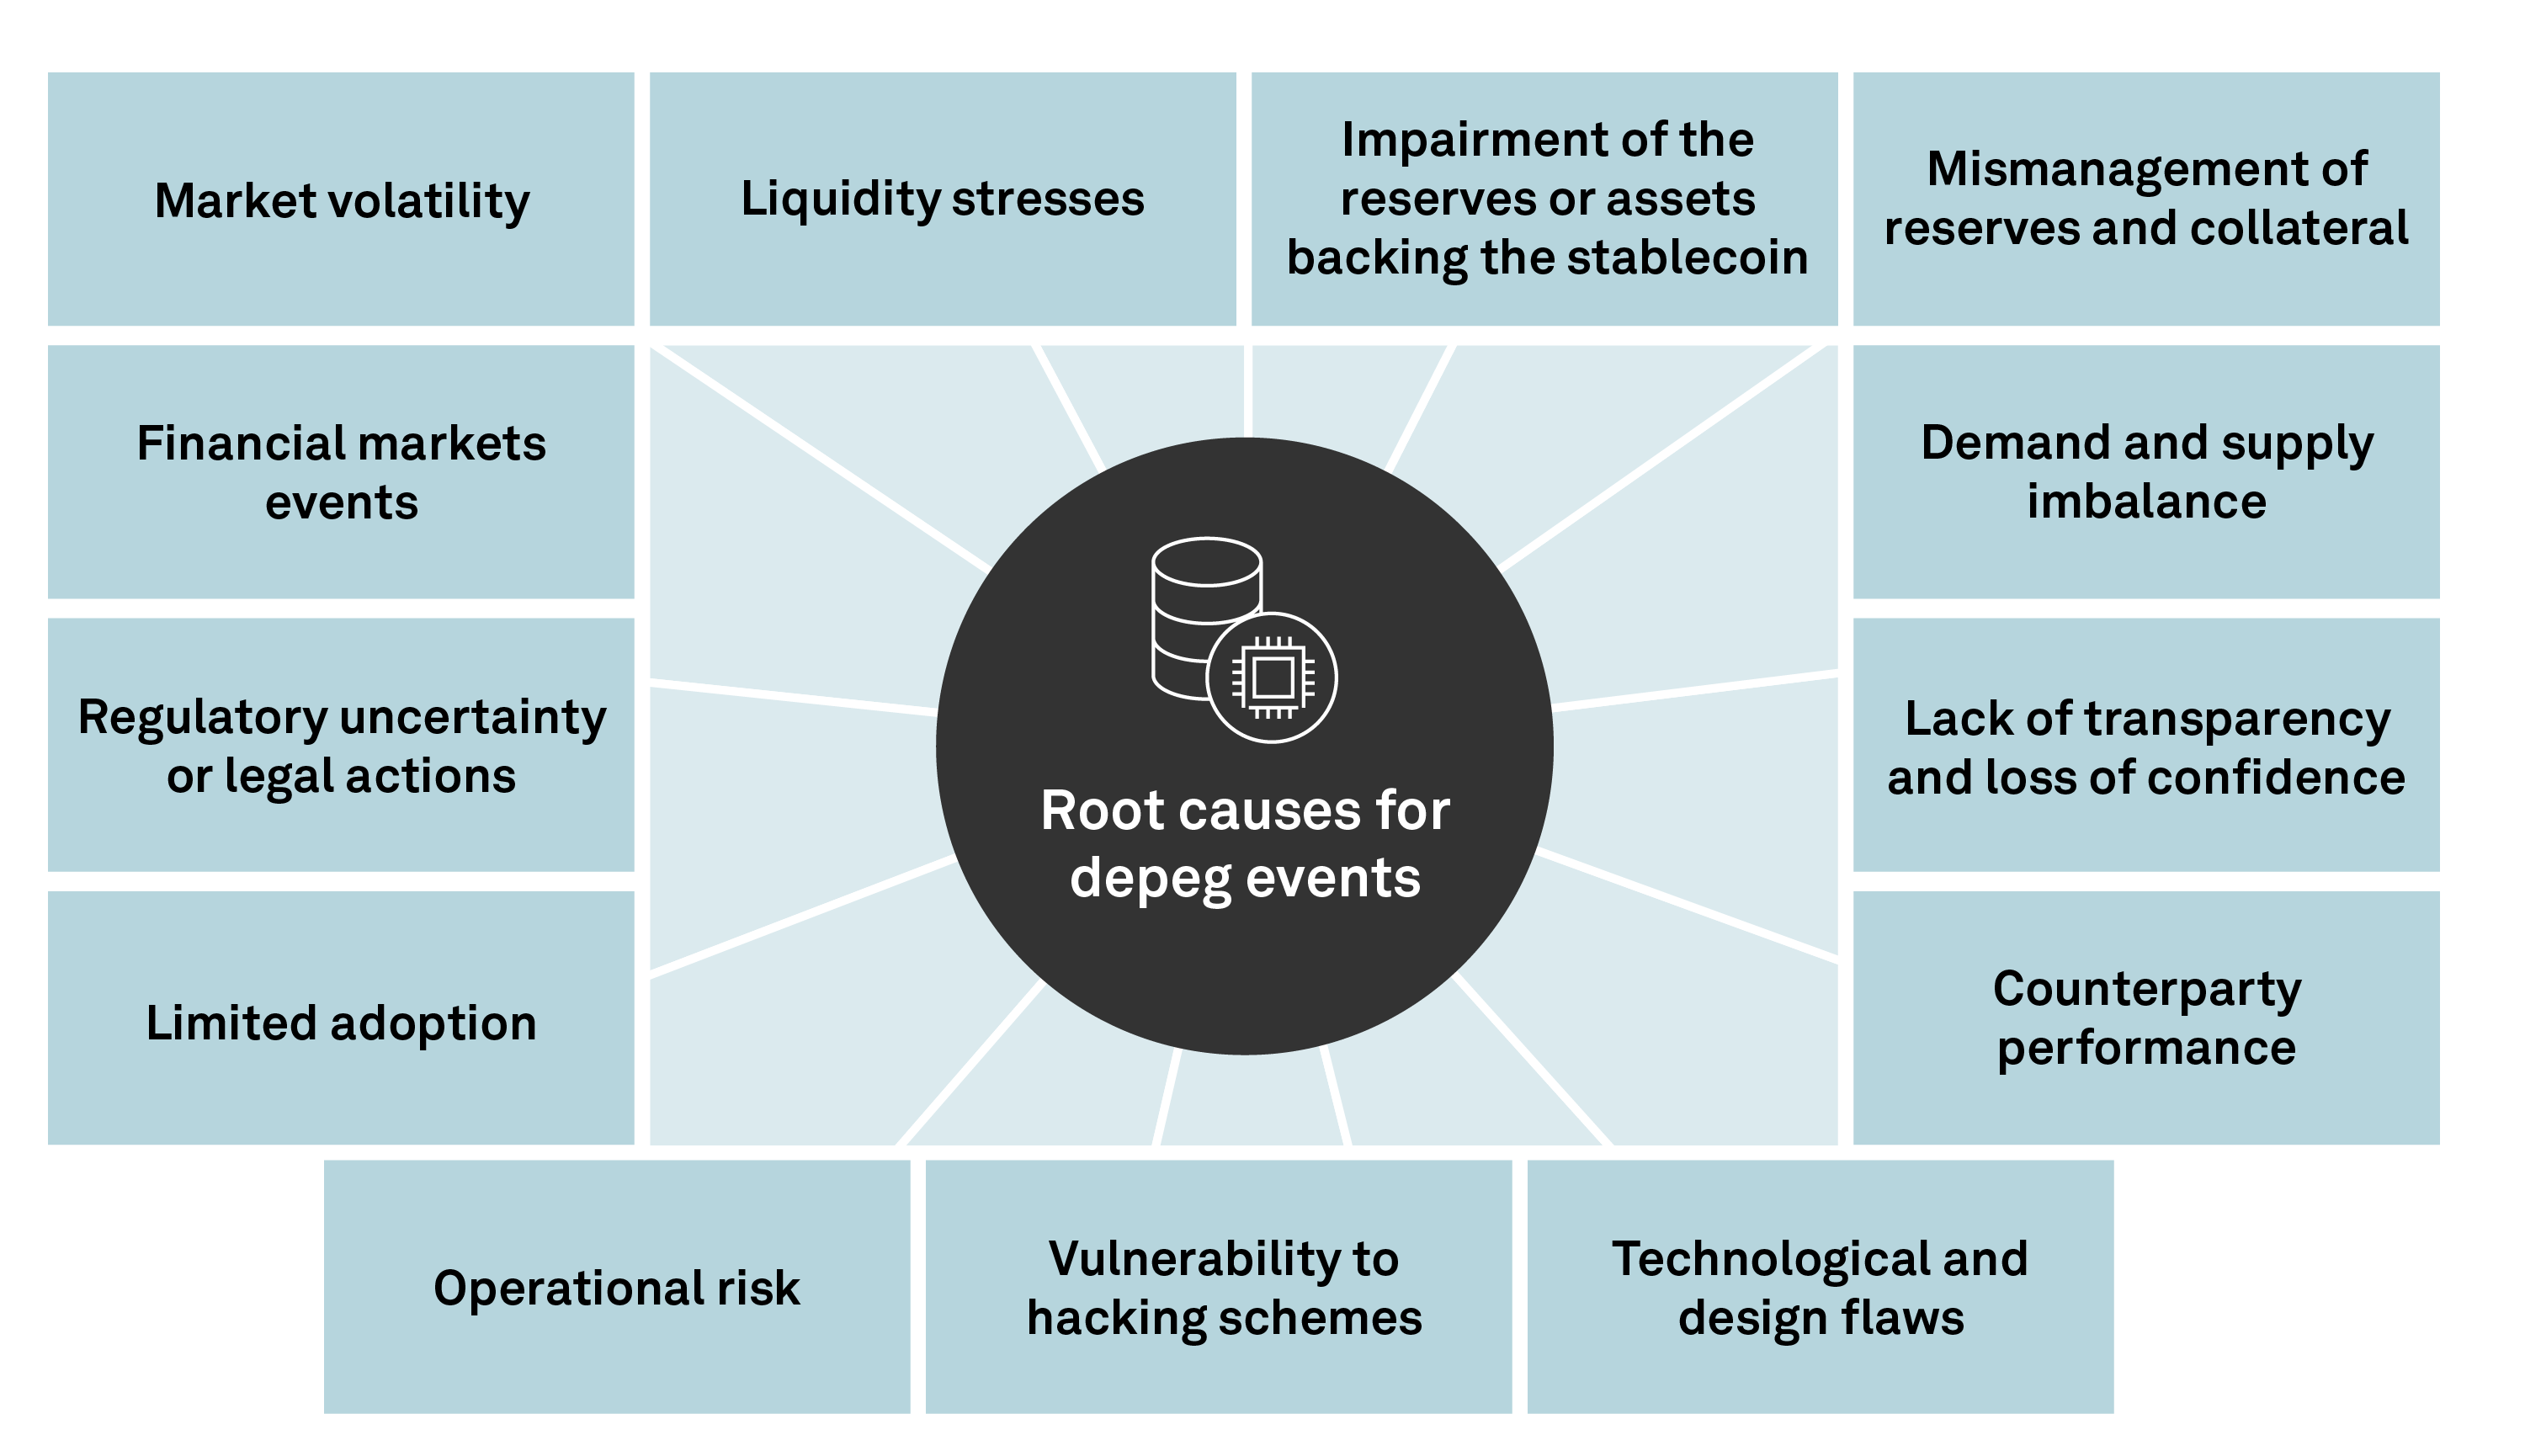
– Market volatility can put downward pressure on the price. It could also trigger a flight to quality and increase demand for stablecoins as a store of value, which in turn could increase the price of the stablecoin above its peg.
– Liquidity stresses, caused by high market volatility, may impact demand and distort the stablecoin’s price from its peg.
– Impairment of the reserves or assets backing the stablecoin may cause a shortfall in collateralization, triggering a loss of confidence and, potentially, legal action.
– Mismanagement of reserves and collateral can impact the stability of the stablecoin valuation and cause a depeg.
– A sudden increase in demand can push the price above $1 (this could be a true demand or market manipulation). Low demand and excess supply can put pressure on the peg and cause the price to fall below the peg.
– Lack of transparency and loss of confidence can cause massive sell-offs.
– Counterparty performance is relevant as any financial, operational, legal or regulatory issues the counterparty responsible for the stablecoin’s peg has may negatively impact the ability to preserve the peg. For centralized stablecoins minted by an issuing entity that also has control of the reserves, insolvency or fraud could result in losses for the holders of the stablecoins if the accounts are not held in a separate special purpose vehicle or the creditors’ rights are not clearly delineated.
– Technological and design flaws such as that of TerraUSD, which collapsed in May 2022, may lead to a permanent depeg and could cause a stablecoin to become defunct.
– Vulnerability to hacking schemes can destabilize stablecoins’ valuation and cause a depeg event.
– Operational risk due to network congestion can delay the flow of payments and impact the stability mechanisms of stablecoins.
– Limited adoption may impact trading volume and market cap, which in turn influence valuation through low liquidity.
– Regulatory uncertainty or legal action may lead to a loss of confidence and limit liquidity.
– Financial markets events can spill over into the stablecoin ecosystem, put downward pressure on a stablecoin’s value and cause depeg events.
The stability of stablecoins differs depending on the type of assets backing them. Some are fiat- or commodity-backed, others are crypto-collateralized, and some are not collateralized. Of the five coins we study, four are largely RWA collateralized (USDT, USDC, BUSD and USDP). Approximately half of the fifth, DAI, is generated against RWA collateral, with the rest backed by stablecoins and other crypto-assets.
As they are all built to maintain a $1 peg, we can analyze common patterns in price behavior. Arguably, their valuation must be influenced by events that affect the cryptocurrency ecosystem — a spillover from the financial industry, for example — but they can also be individually affected by idiosyncratic events and targeted actions. We study whether their historical price and return data exhibit common patterns, using price, returns, volatilities and correlations data.
First, we looked at minute-by-minute data for price levels, first-order differences and price returns. We chose the 24 months ending June 2023 to eliminate the volatility that often accompanies the launch of a new coin, usually defined by sparse trading volume and low market cap. BUSD is the newest stablecoin among the five, with a start date of Sept. 5, 2019.
Figure 6 juxtaposes the price levels for all five coins using a box-plot framework. The dips below $0.90 for USDC and DAI are caused by the SVB collapse in March 2023, during which the price fell to $0.87 for USDC and $0.85 for DAI.
Figure 6
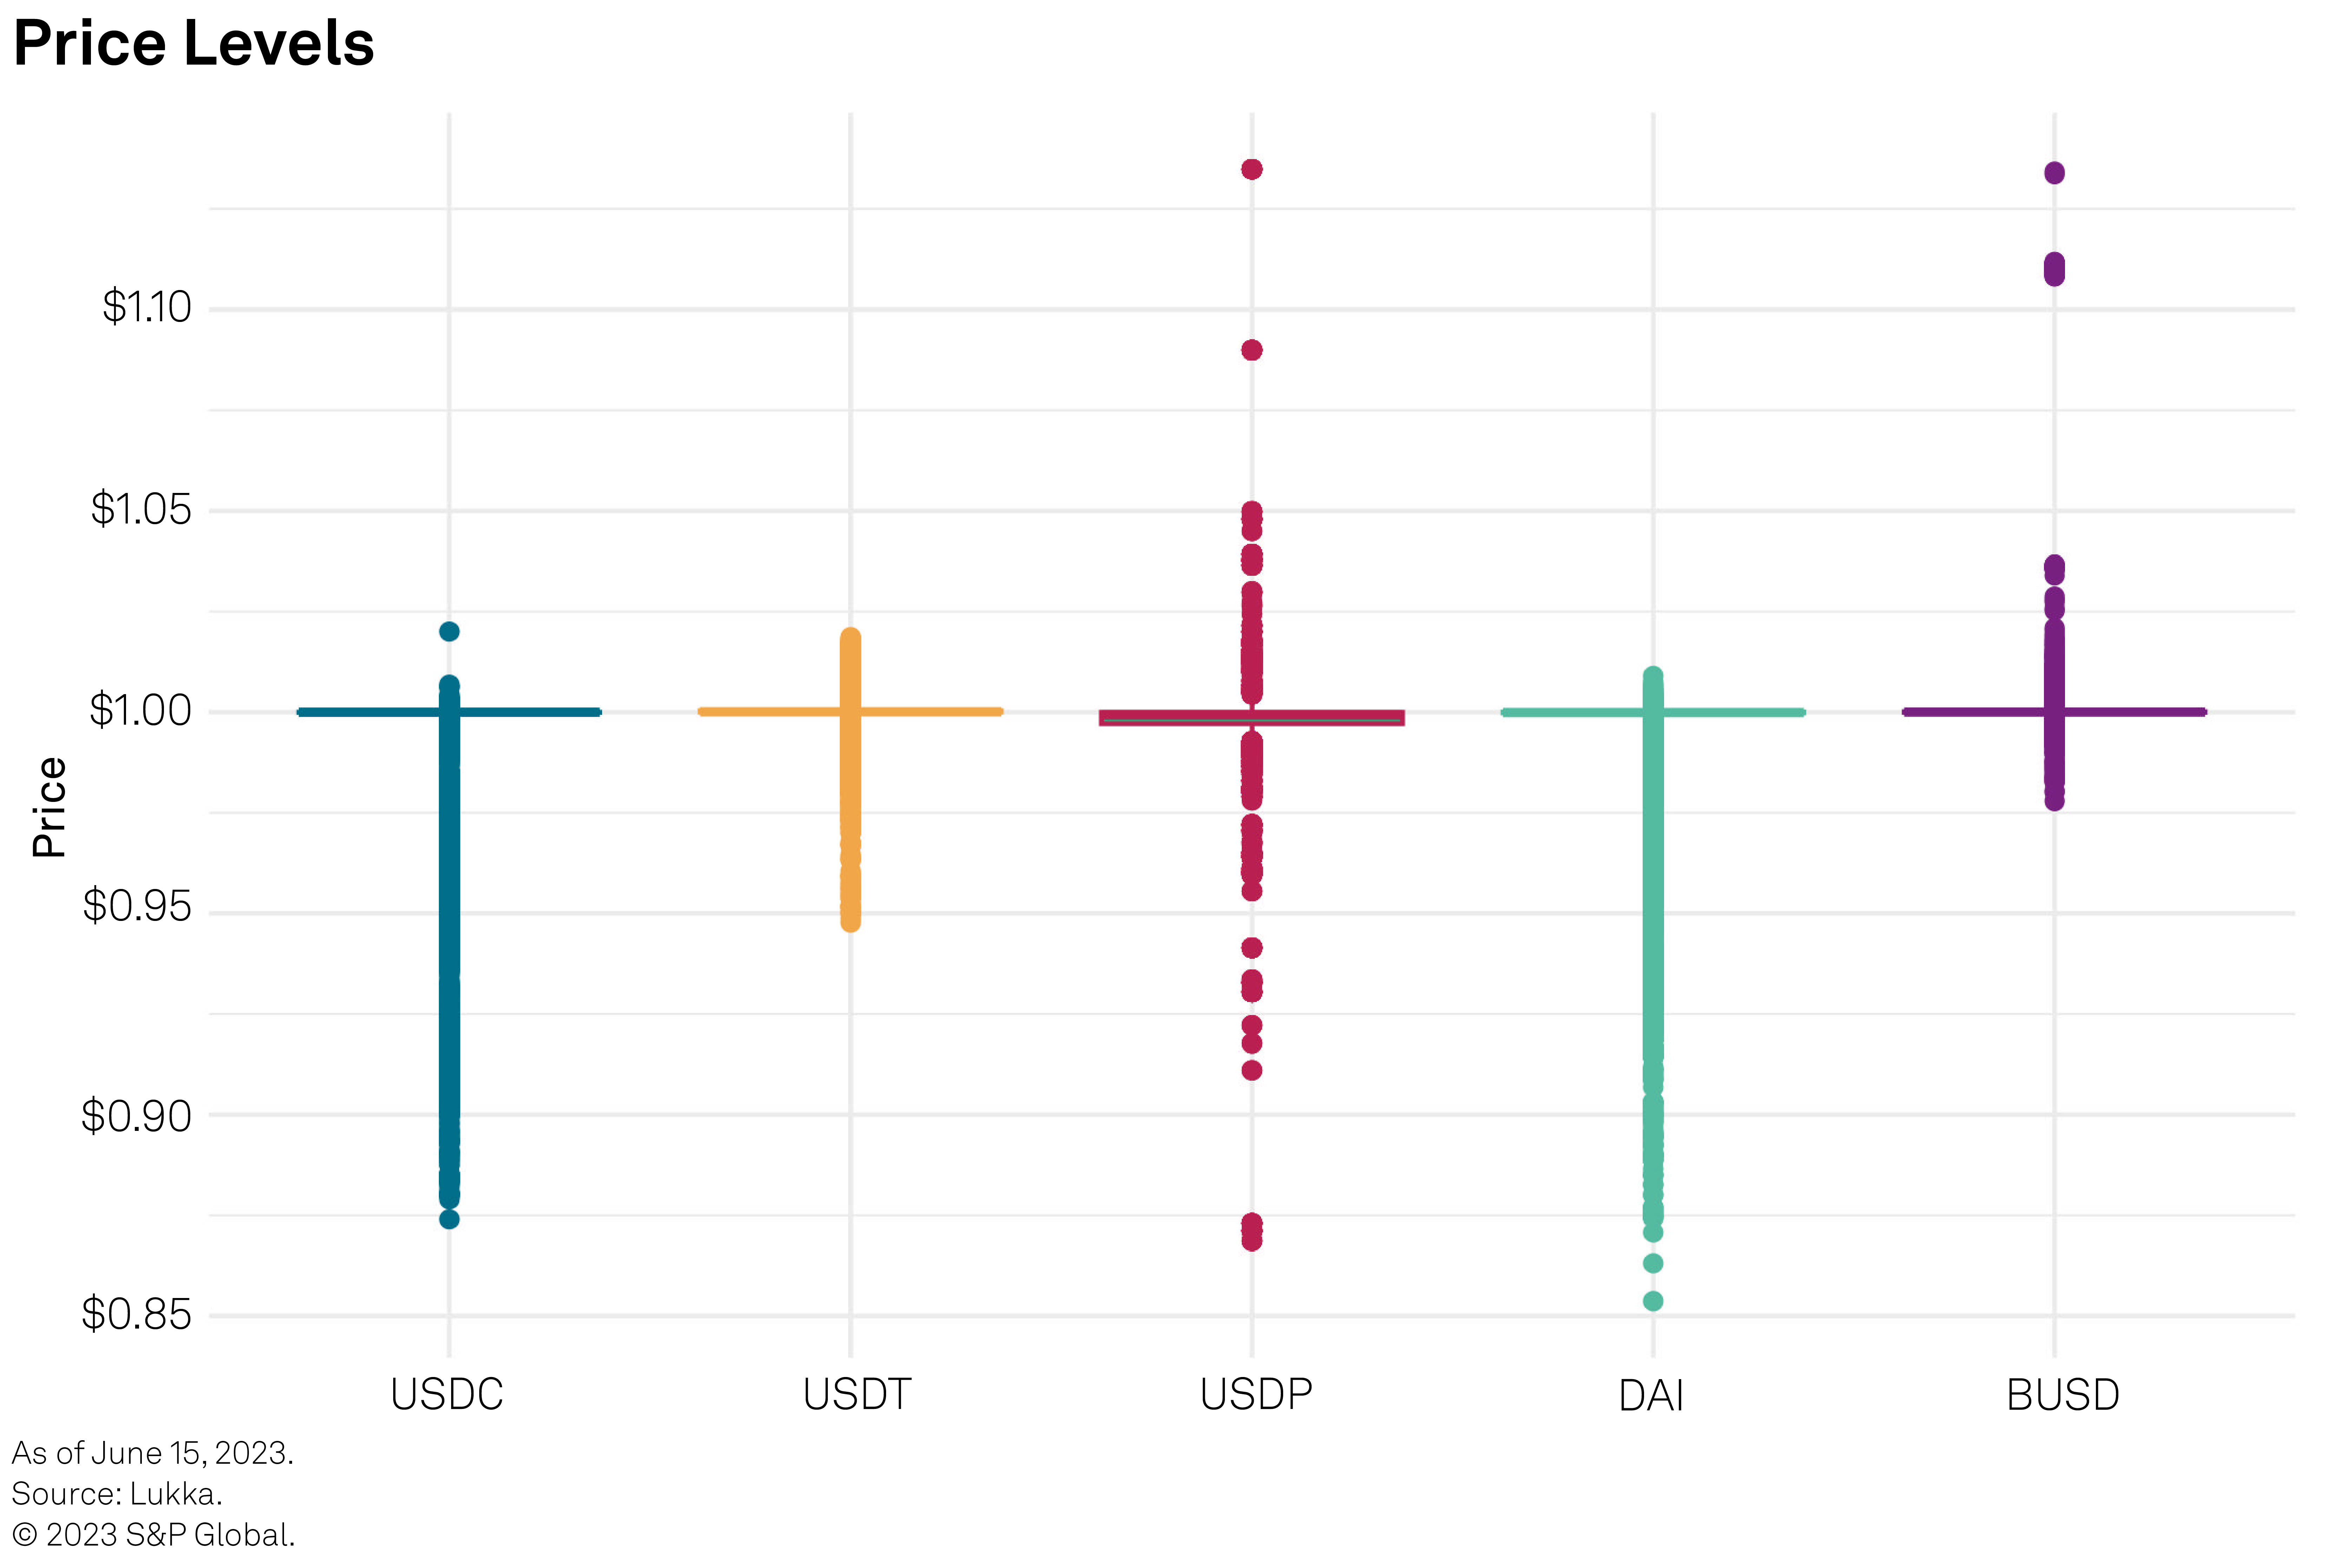
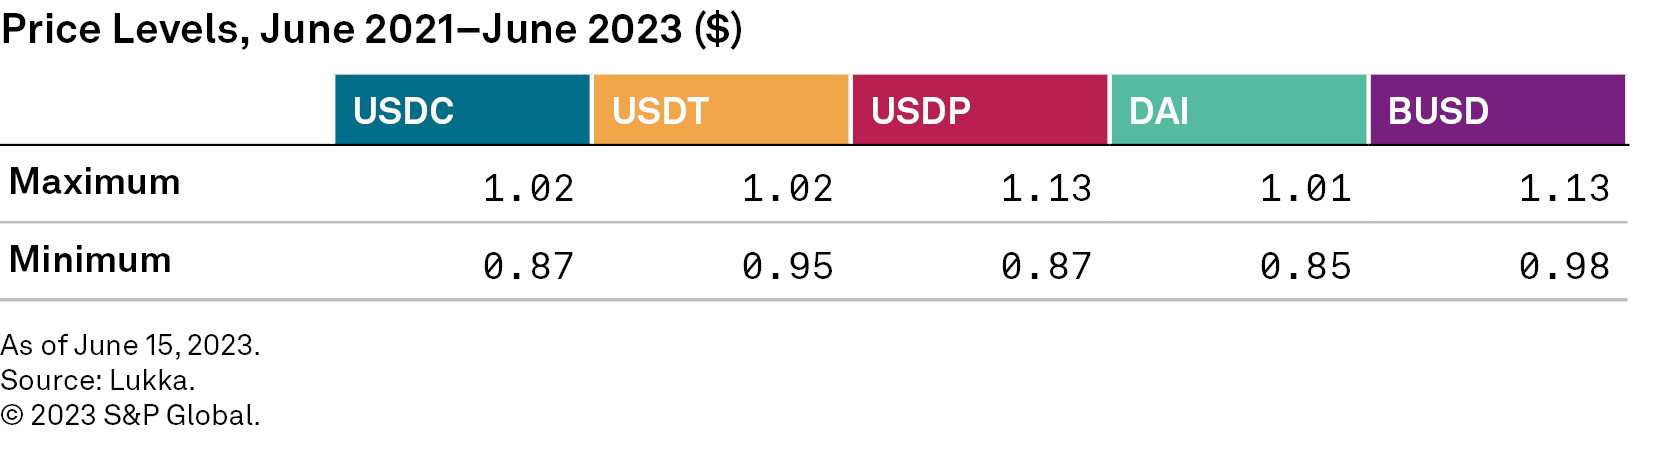
Figure 7 shows the maximum and minimum price levels attained by stablecoins. We find that depeg events below and above $1 are generally asymmetrical and differ among the five coins. The prices for USDC and DAI do not exceed $1.02 but fell as low as $0.87 and $0.85, respectively. USDP exhibits the highest deviations above and below $1. USDP has a significantly lower market cap and trading volume than the other four and its price is more volatile as a result.
Figure 7
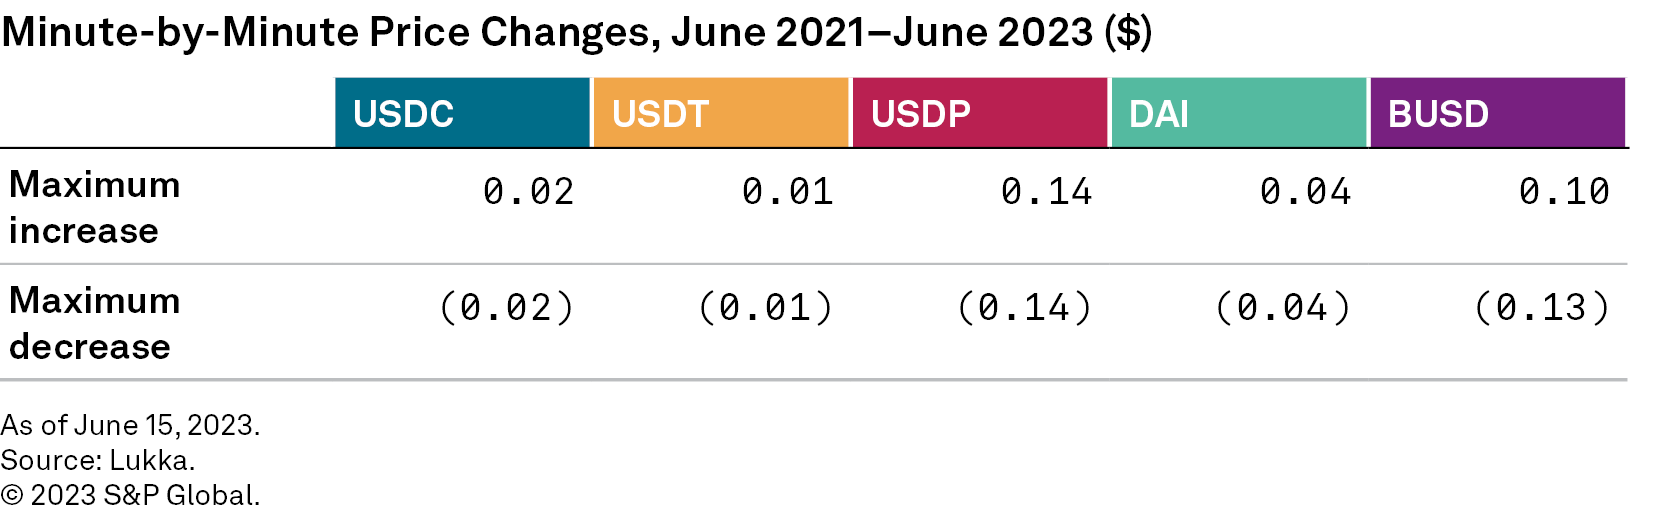
Next, we looked at price changes in terms of first-order differences. Figure 8 shows the maximum increase and decrease in price over a one-minute period for each of the five coins. USDP and BUSD exhibited the biggest drop in price over one minute at $0.14 and $0.13, respectively.
Figure 8
We also calculated percentage price changes over one minute for all five coins. Figure 9 shows the maximum and minimum for historical minute-by-minute returns. USDP exhibits the highest price changes over a one-minute time frame.
Figure 9
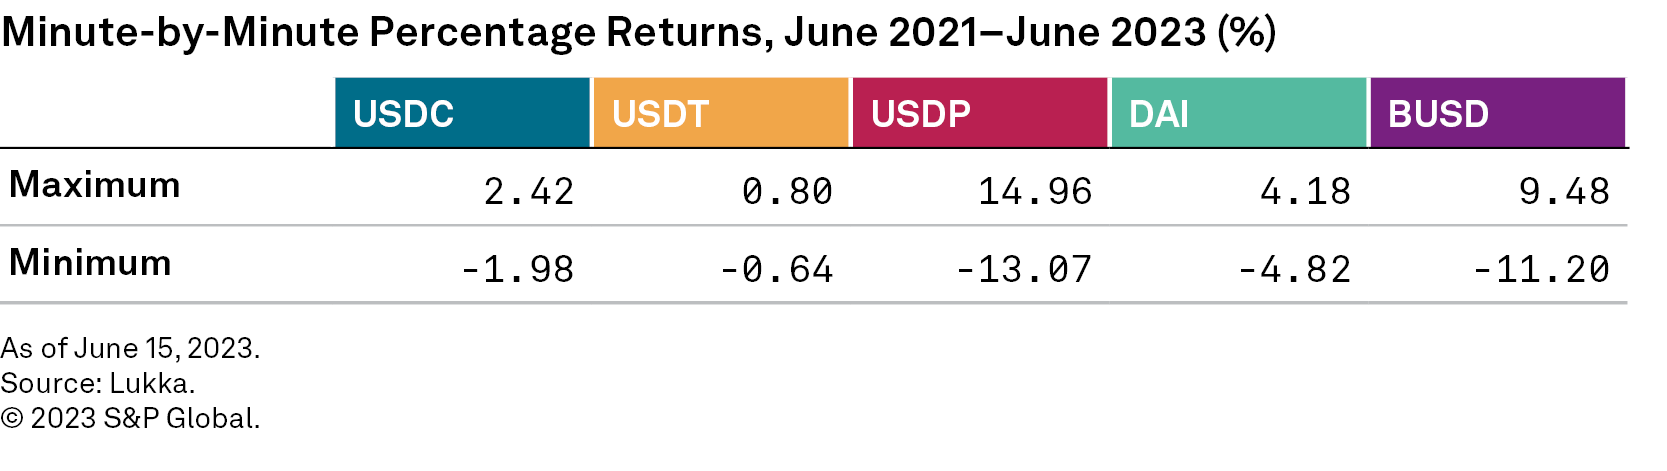
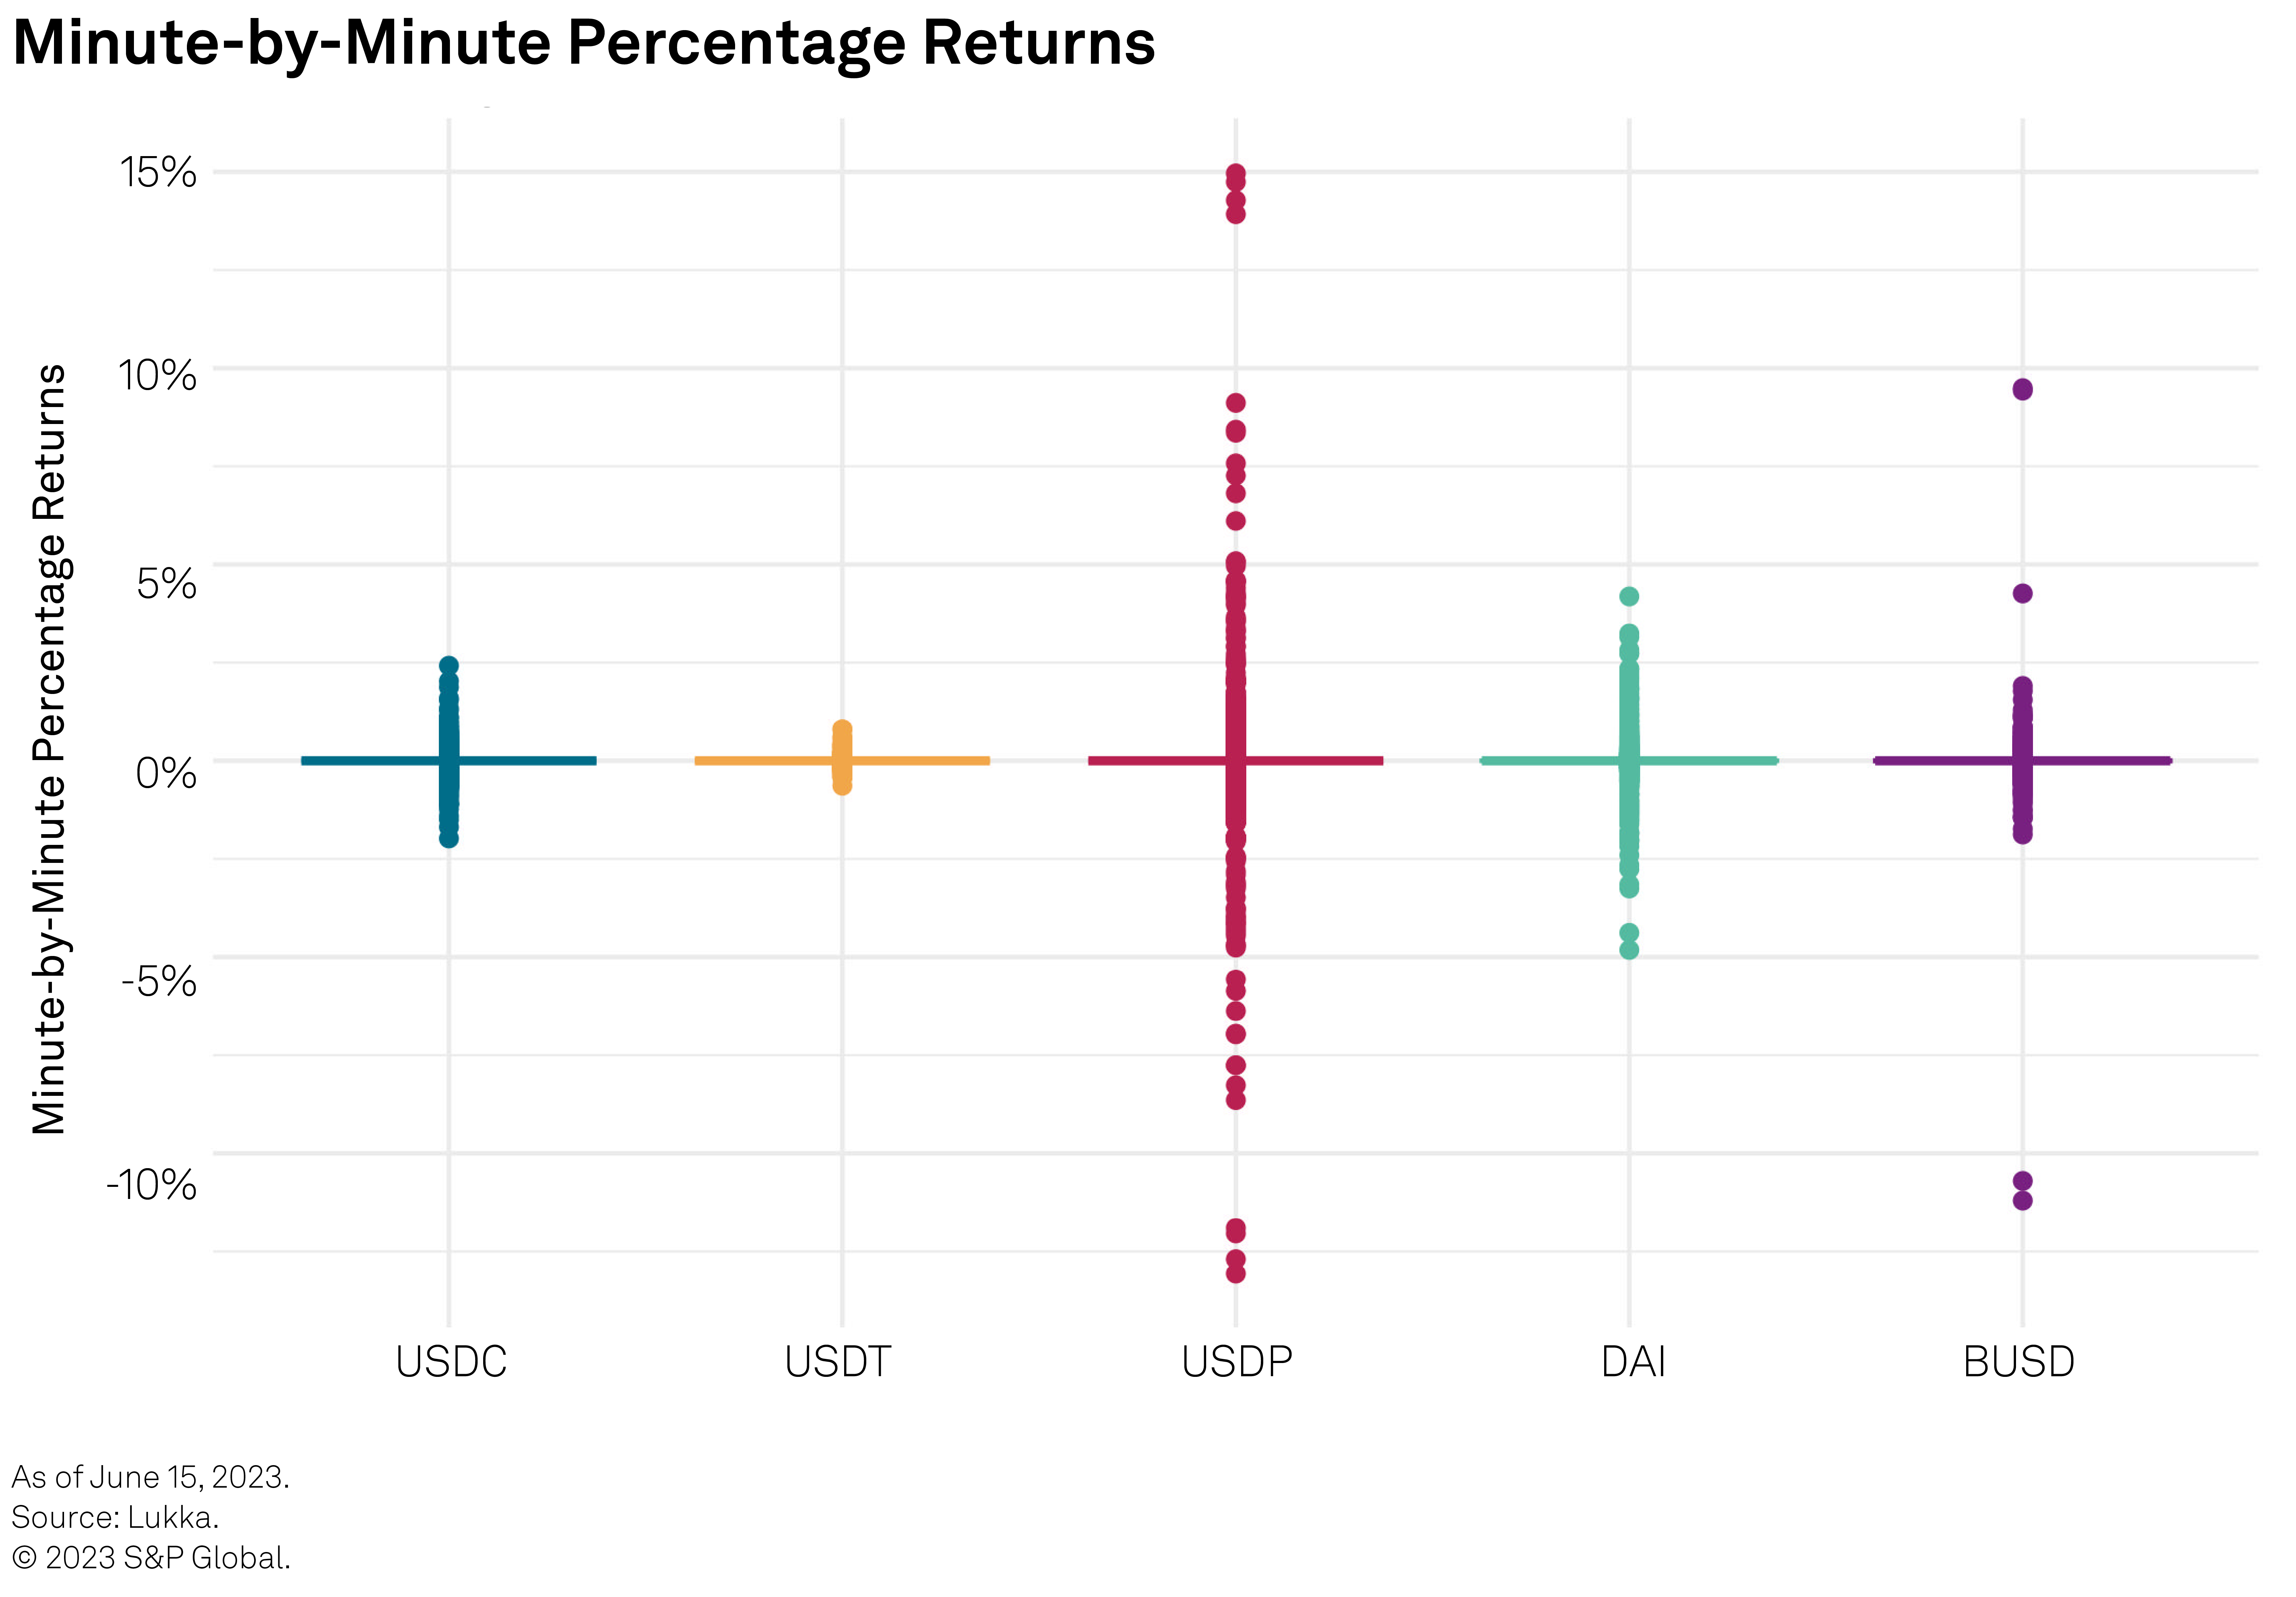
Figure 10 shows a box-plot for the percentage returns of the five stablecoins over the study’s considered time period. USDP has the largest dispersion of returns, followed by DAI, USDC, BUSD and USDT.
Figure 10
Weekend Effects
While the cryptocurrency market is a 24/7 and 365-day market, RWA-backed stablecoins rely at least in part on traditional payment rails to support issuance and redemptions for fiat currency. The amount of cash that stablecoin issuers hold in the banking system can limit available liquidity to support redemptions outside of traditional business hours.
Whether banks’ weekend closure affects liquidity or price is a frequently asked question. Historical data only spans a few years, the cryptocurrency ecosystem’s interaction with traditional finance is continuously evolving, and there are factors that affect the price both ways depending on which side of the market one is on.
During the weekend of March 11–13, 2023, when the USDC price fell to $0.87, two of Circle’s banking partners that operated redemptions to fiat US dollars, Signature Bank and Silvergate Bank, were no longer operating. Meanwhile, Coinbase paused redemptions of USDC for fiat, making it temporarily impossible for Coinbase customers to convert. Those forced to reduce their USDC holdings traded them for other stablecoins such as USDT, while others exploited arbitrage opportunities between the various exchanges.
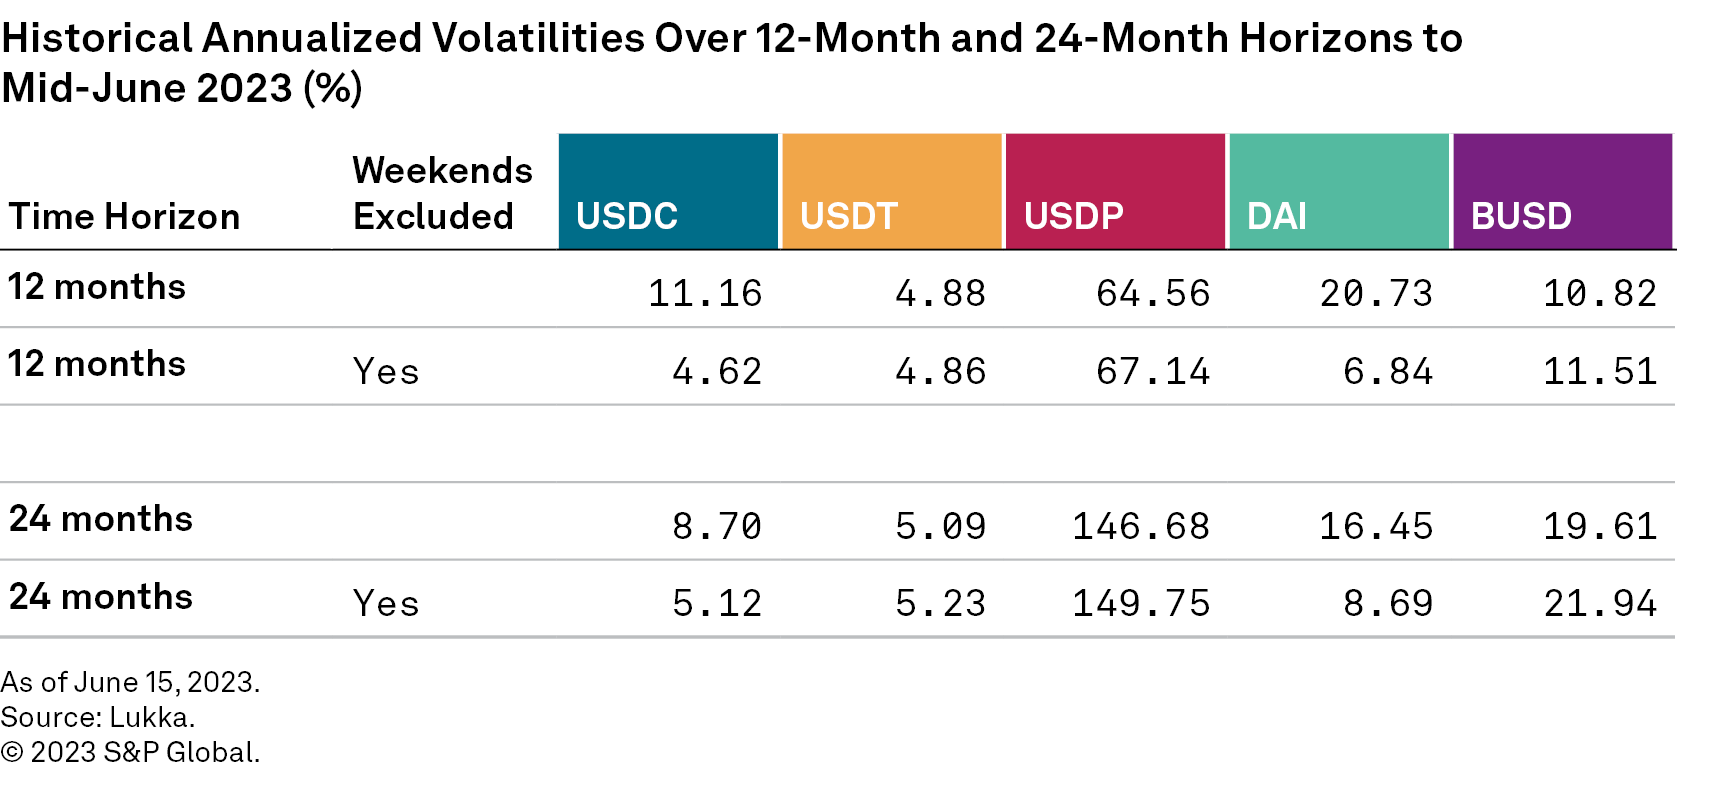
To better gauge the weekend impact, we calculated the volatility over the past 12 and 24 months ending mid-June 2023, both including and excluding weekends, and performed a comparative study. The volatility of USDC and DAI is lower if we exclude weekends. As expected, the weekend of March 11–13, 2023, in which the two coins fell to $0.87 and $0.85, respectively, added volatility to the price (see figure 11).
Figure 11
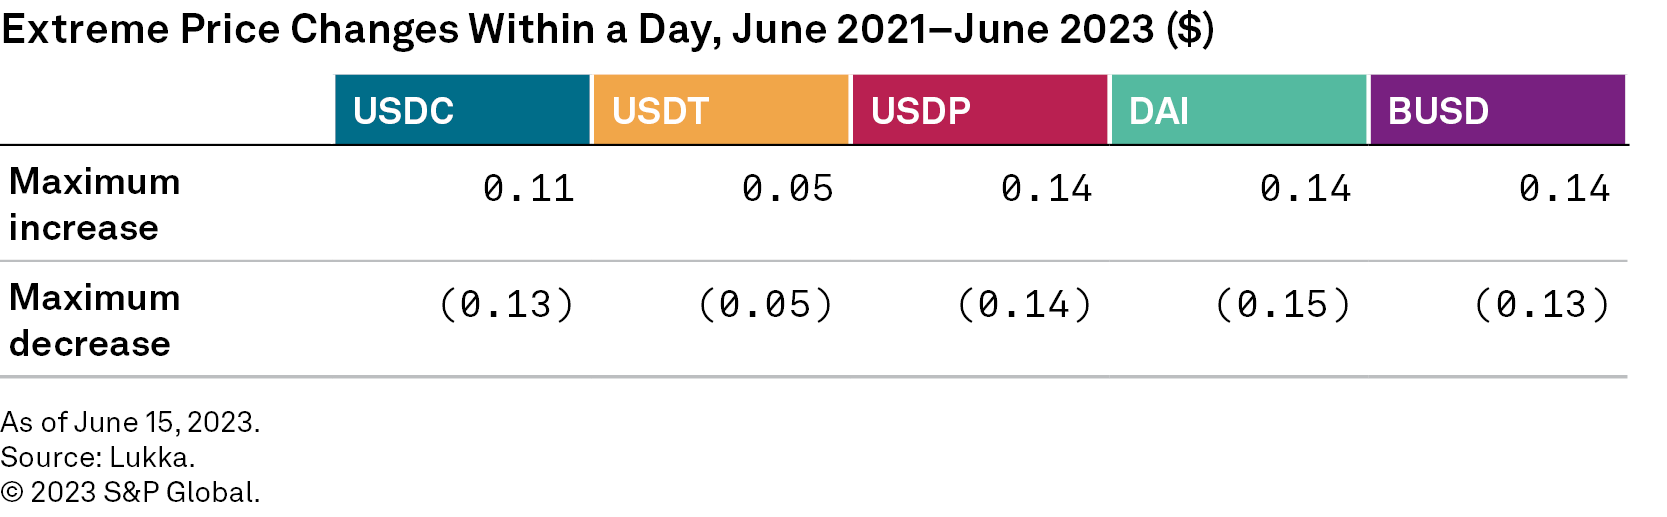
While our data is minute-by-minute, we also looked at the maximum price drops and increases during one day to gauge the deviation from the $1 peg over the course of a day. Figure 12 shows that USDC, DAI and USDP exhibited the worst daily price declines among the five coins.
Figure 12
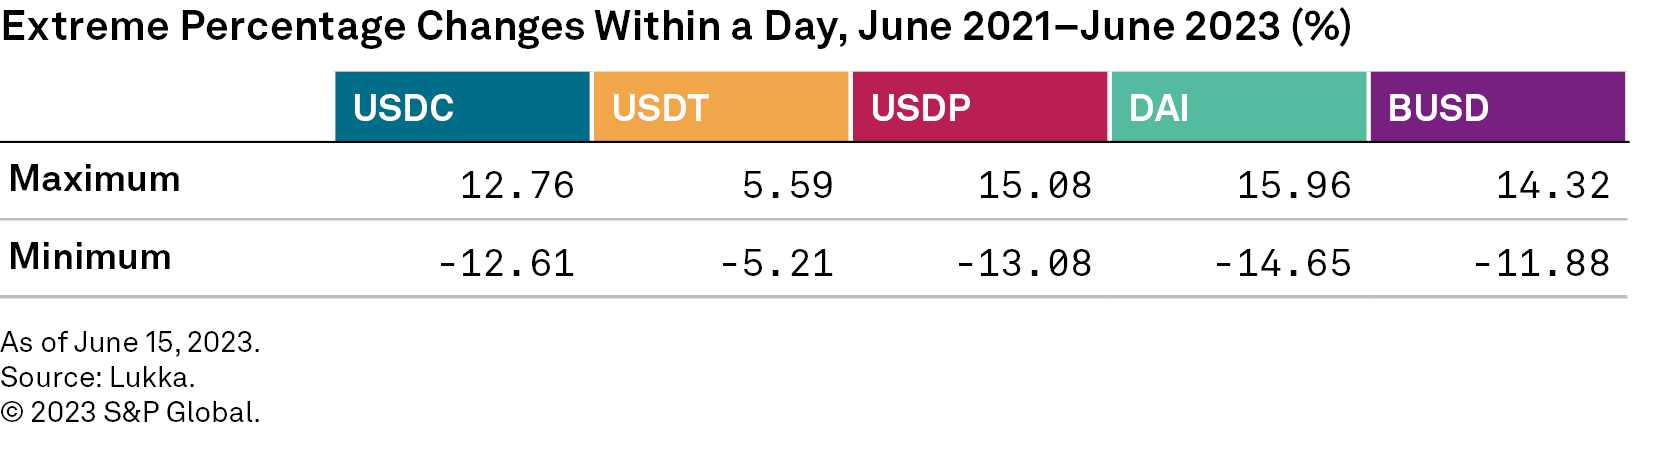
We then expressed these price changes in percentages. Figure 13 shows the highest and lowest percentage changes within a day. DAI exhibits the biggest drop over the course of one day, at 14.65%. As a means of comparison, bitcoin’s worst daily percentage price drop was almost 26%.
Figure 13
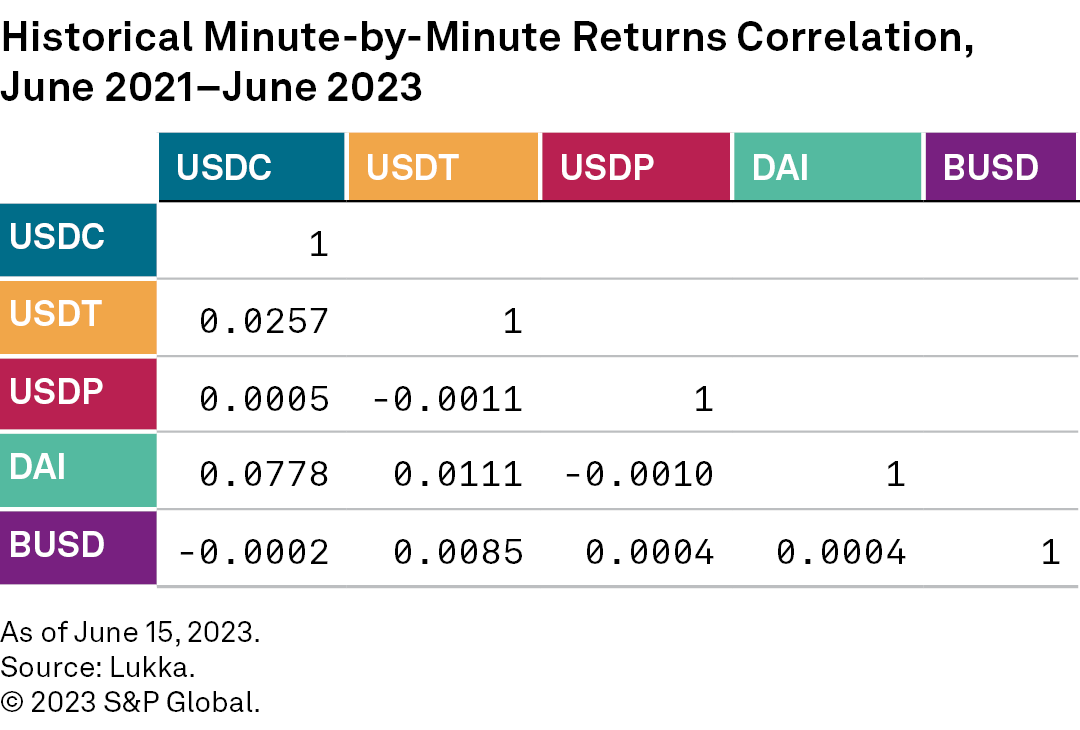
Historical price returns correlation is low, as shown in figure 14, with USDC and DAI exhibiting the highest correlation of 0.0778. This is relevant when analyzing price returns for portfolios of crypto-assets, including several stablecoins.
Figure 14
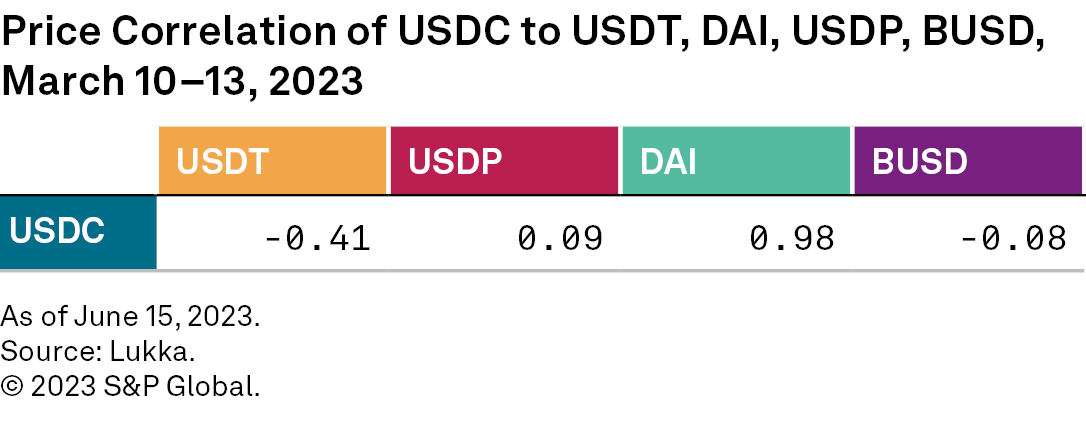
Between March 11 and 13, 2023, USDC and DAI experienced their highest depegs from $1, reaching $0.87 and $0.85, respectively. Over this period, USDC minute-by-minute price levels correlated highly with those of DAI (0.98). They exhibited a negative correlation with USDT (-0.41) as investors bought into this coin to rotate away from the negatively affected stablecoins, pushing up the price of USDT (see figure 15).
Figure 15
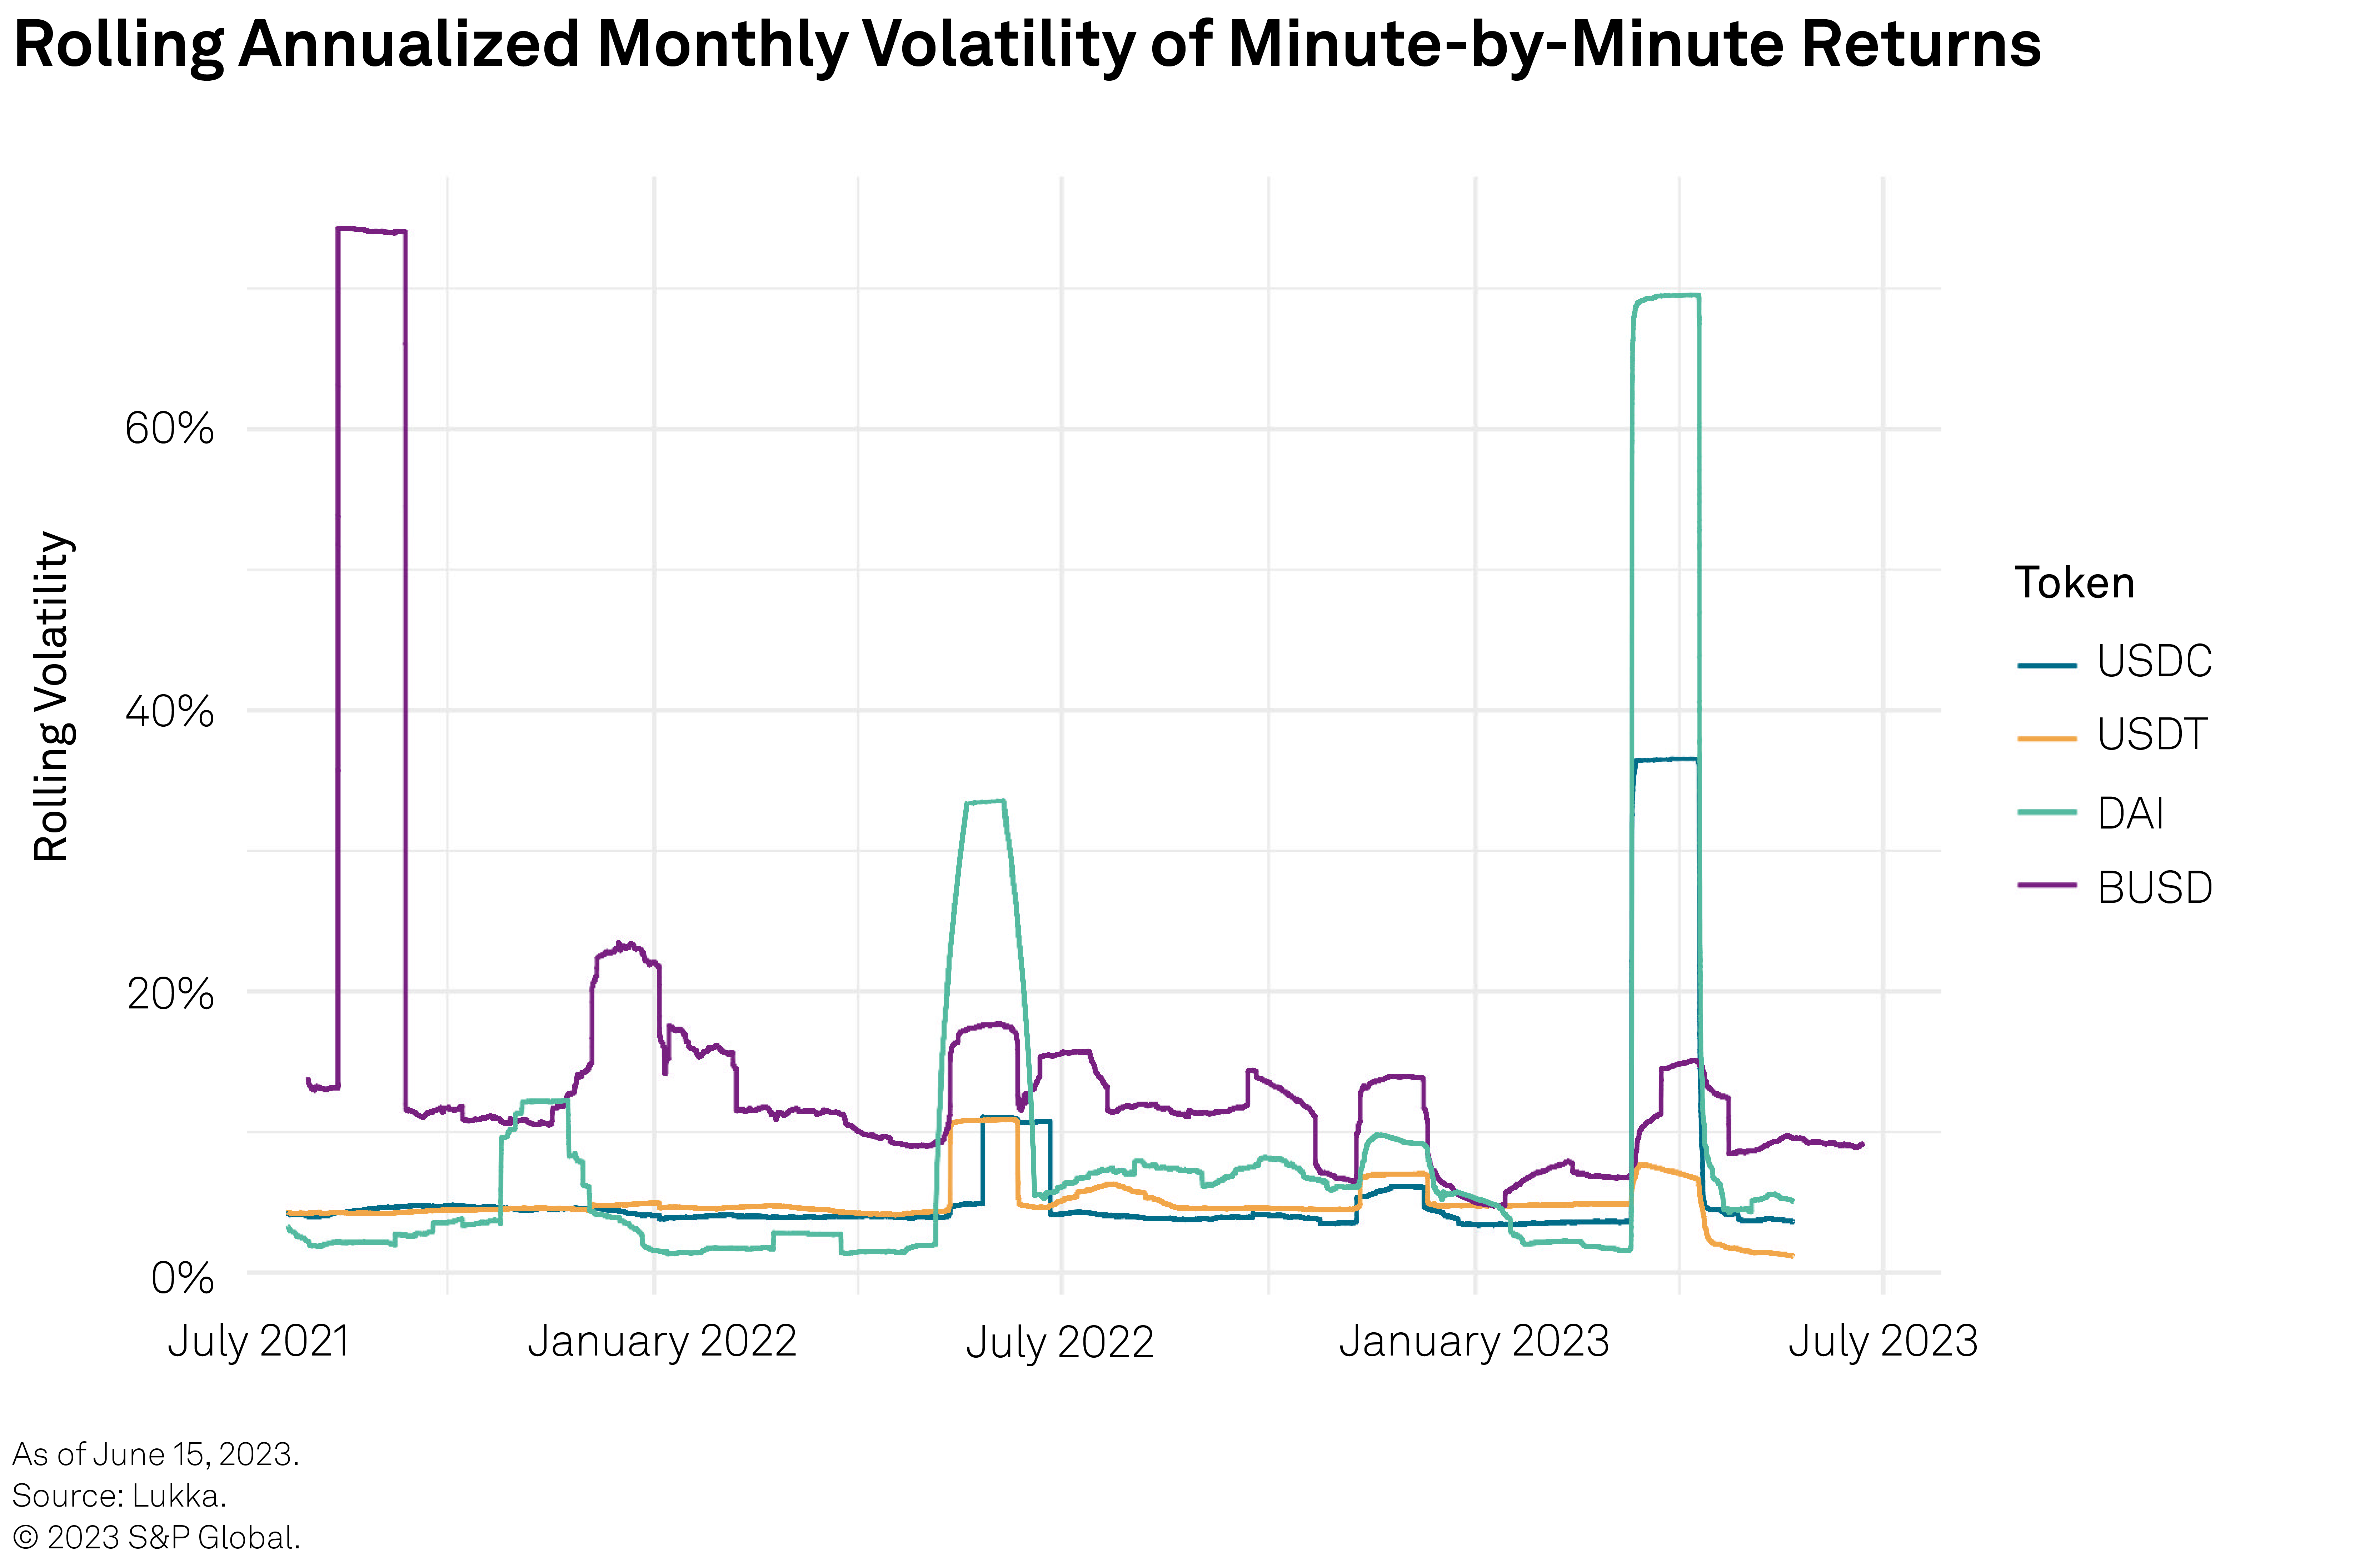
To identify periods of high versus moderate volatility, we analyzed rolling volatilities over shorter horizons. Figure 16 shows annualized volatilities of minute-by-minute returns over a one-month horizon rolled forward for USDT, USDC, DAI and BUSD. Using rolling periods, we see the variability of the monthly volatility and can identify periods of increased volatility, such as March 2023 for USDC and DAI. USDP exhibits higher volatilities than the four stablecoins, reaching levels of 300% in selected months.
Figure 16
The study compared the frequency, magnitude and depeg persistence for each of the five coins. The magnitude of the depeg events was examined by fixing thresholds above and below the pegged value of $1. Strictly speaking, any deviation from $1 is a depeg event, but we also want to evaluate the magnitude of such deviations; hence, we link the analysis of depeg events to different thresholds.
Note:
– The depeg magnitude is important as we are more concerned when prices fall below $0.90 than when they fall just below $0.99, for example. A more persistent deviation below the $0.90 threshold is more impactful than a deviation confined to the interval between $0.99 and $0.98.
– We selected thresholds ranging from $0.90 to $1.10 in increments of half of a cent ($0.005). As all studied stablecoins aim to preserve the $1 peg, we find that thresholds (below and above $1) are appropriate metrics to measure the depeg magnitude that can be further compared across stablecoins.
– We then built a framework to account for the number of times a threshold was breached and the duration of the breach. This creates a consistent measure across the stablecoins that can quantify the historically observed price deviations from various thresholds.
– We fix thresholds that represent the magnitude of the depeg.
– The study covers the 24 months to June 2023.
– We look at depeg events above and below $1 in similar ways.
The Analysis for Below-$1 Depeg Events
– We note the time of breach of a given threshold and the time it takes for the price to return to that threshold. This represents the persistence of the price deviation below that threshold and is expressed in minutes.
– By aggregating the persistence of the price deviations below a given threshold for all instances, we calculate the total length of time the price stayed below the given threshold.
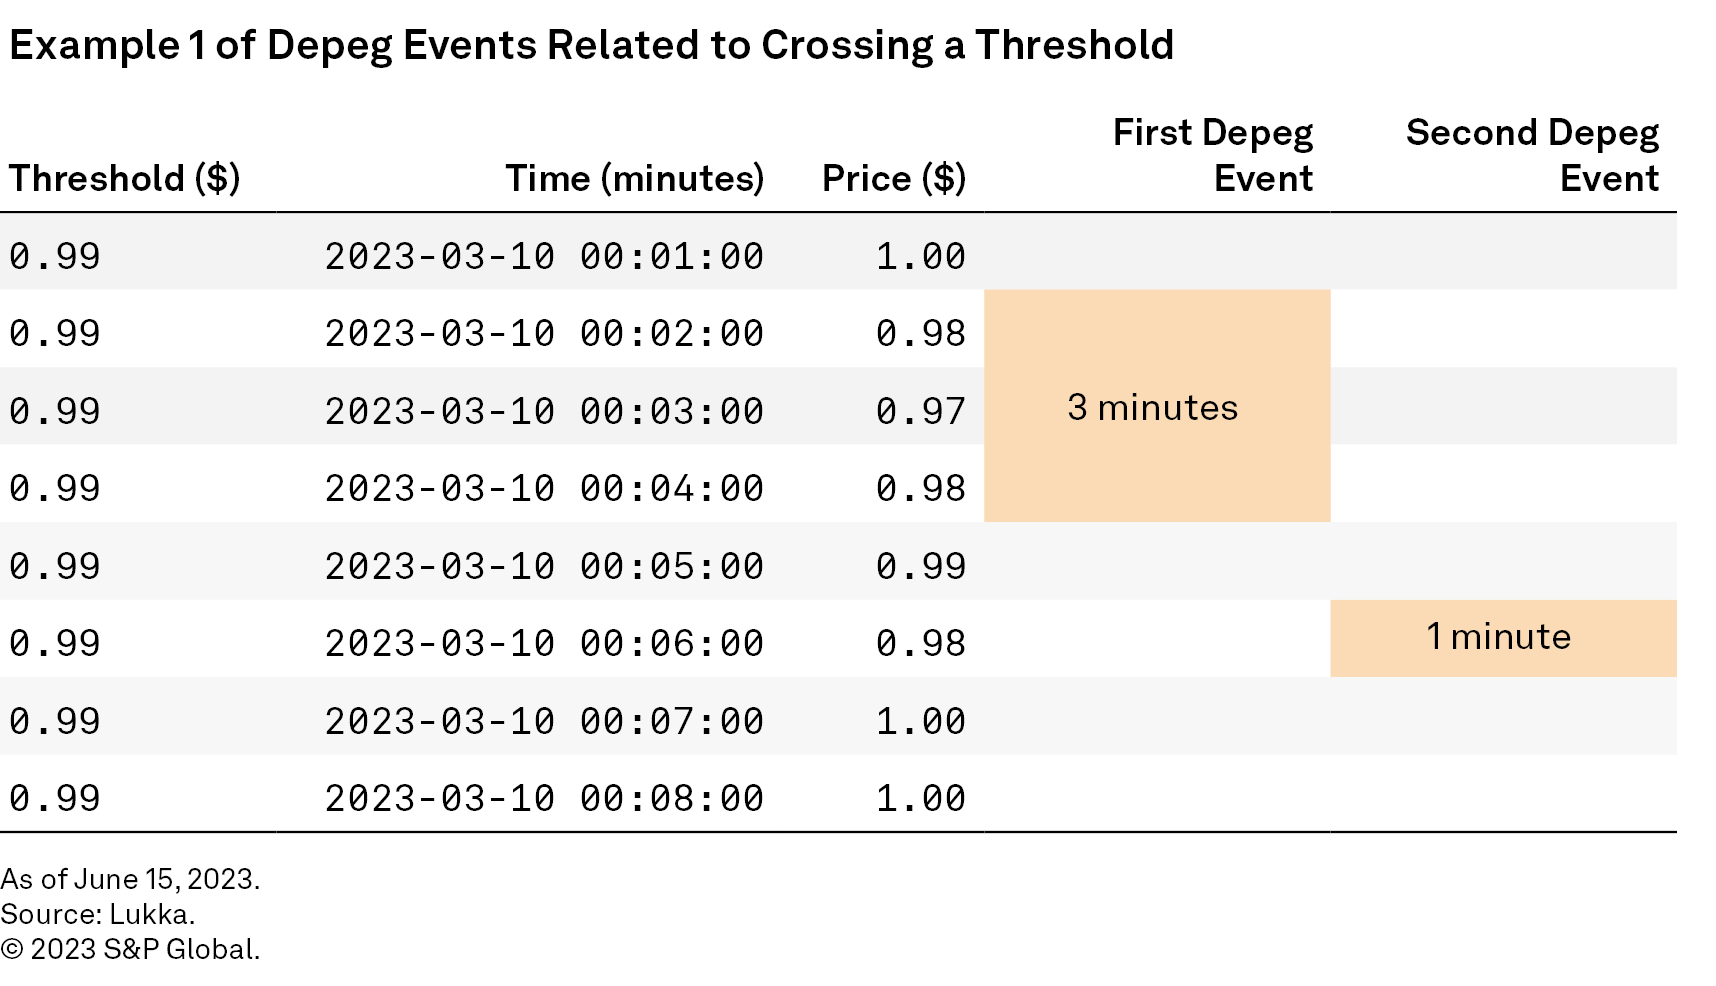
Example: For a $0.99 threshold, we count the number of consecutive minutes the price stayed below the threshold from the time stamp at which the price first fell below it. This counts as a depeg event for the $0.99 threshold and adds one instance to the depeg frequency below $0.99. If in this instance the price were below $0.99 for three consecutive minutes, we add the three minutes to the depeg persistence calculation for the $0.99 threshold. It is important to evaluate this, as an extended depeg event below $0.99 is more consequential than a shorter one. Additionally, depegging below $0.99 adds more stress on the price than a depeg event where the price is confined to a narrower interval closer to $1, for example, $0.995 to $0.999.
Assume we study the price of a stablecoin over a total of eight consecutive minutes and we are interested in analyzing the depeg events below a threshold of $0.99. In the example illustrated in figure 17, we would have two instances where the price fell below $0.99, the first lasting three minutes and the second only one minute.
Figure 17
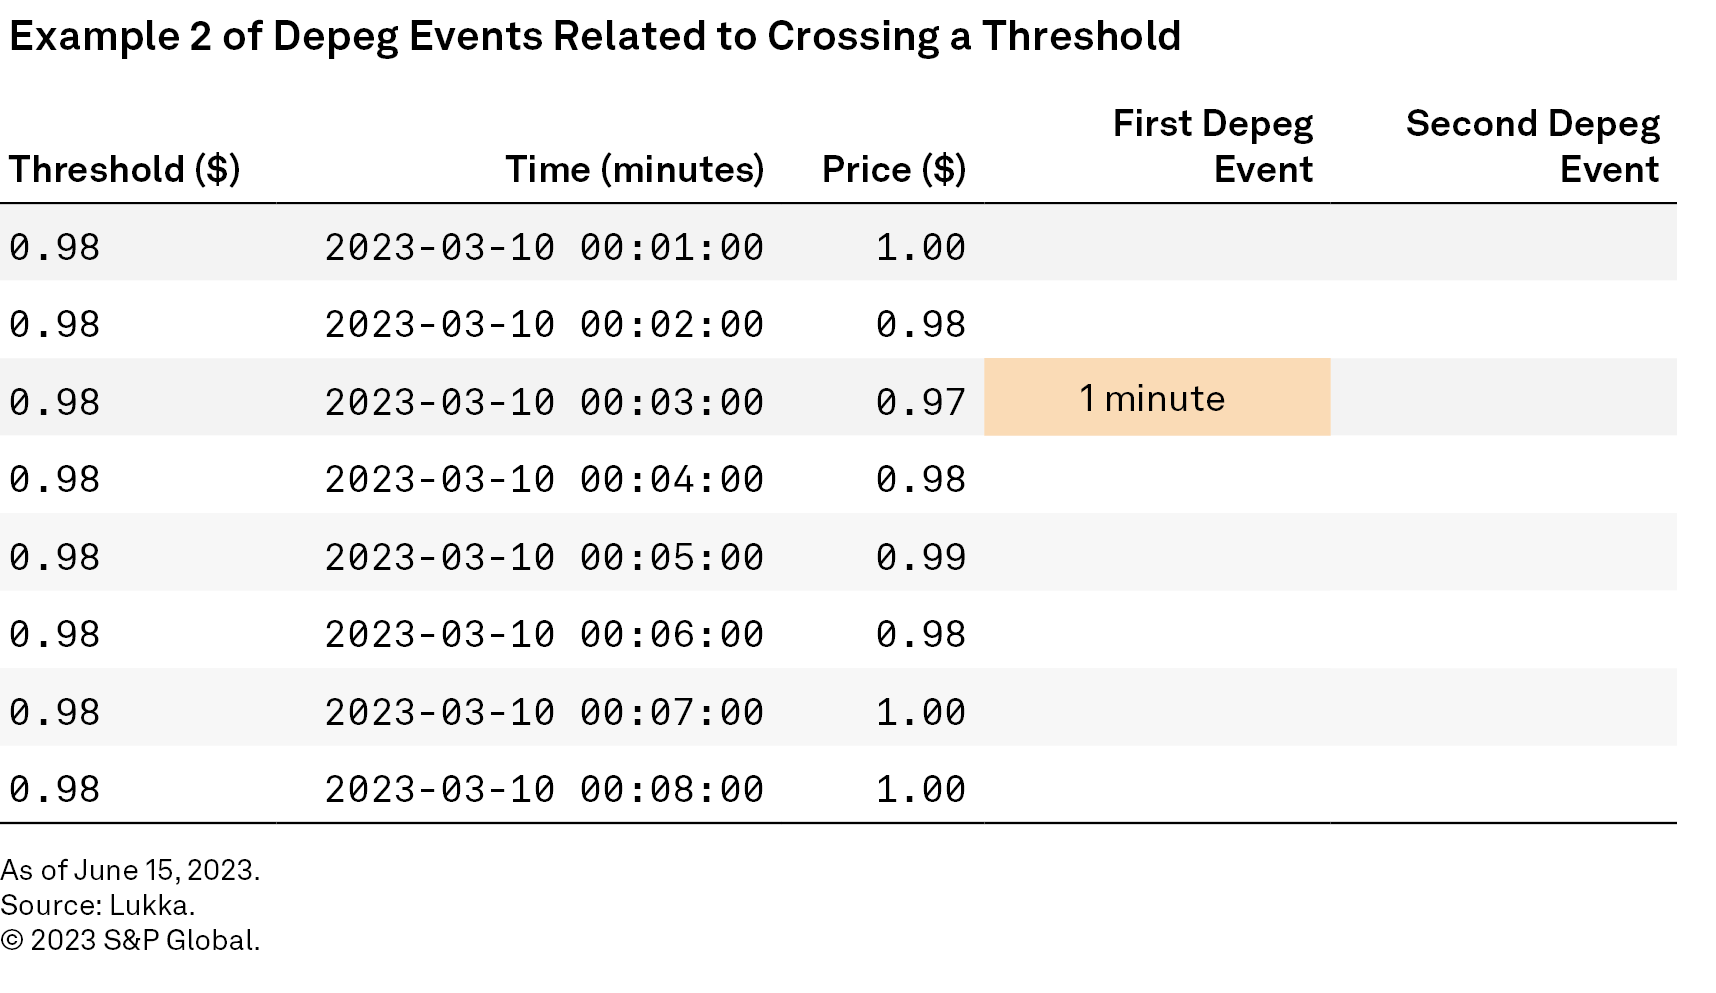
In the same eight minutes, the price fell below another threshold, $0.98, only once and for a length of one minute, as shown in figure 18.
Figure 18
Our analysis found that to study the depeg from $1 it is best to focus on various magnitudes of depeg based on different thresholds and then to quantify the frequency and persistence of depeg events based on the threshold being breached. It is less impactful for the price to drop below $0.98 for one minute than if it were to stay lower than $0.98 for 100 minutes.
Figure 19 shows the depeg frequency (left axis) and the total time in minutes that the price stayed below thresholds ranging from $0.90 to $1.
BUSD’s price did not drop below $0.975, while USDT bottomed out at $0.945. Both USDC and DAI dropped below $0.90 in March 2023 in connection with the SVB collapse. Total depeg time is positively related to the thresholds, i.e., the lower the threshold, the less time the price remains below it. This is because the time spent below a threshold is counted when analyzing the time spent below higher thresholds that are closer to $1.
The frequency can increase as the considered thresholds are lowered. For example, if the consecutive prices each minute were $0.99, $0.98, $0.95, $0.98, $0.95 and $0.99, we would have one event lasting four minutes for a threshold of $0.99, and two events lasting one minute each for the $0.98 threshold. We then analyzed the lowest threshold considered in our study and noted that USDT and BUSD did not depeg below $0.90, while the price for USDC, DAI and USDP remained below $0.90 for a total of 73 minutes, 63 minutes and 82 minutes, respectively.
Figure 19
A one-minute depeg event can be attributed to noise, especially for thresholds closer to the $1 peg value; so, arguably, an event where the stablecoin depegged for longer than one minute could be considered more meaningful. For this reason, the study was extended to depeg events that last longer than one minute. The example shown in figure 20 considers five-minute or longer depeg events. We found that the frequency of depeg events decreases with this additional filter, as events where the price stayed below the threshold for one, two, three or four minutes are excluded.
Figure 20
We then looked at the longest depeg events for every threshold. As expected, the lower the threshold, the shorter the consecutive number of minutes spent below that threshold. We found that the longest depeg event below $0.90 for USDC lasted 23 consecutive minutes and for DAI, 20 consecutive minutes. The price for USDT dipped below $0.95 for only one minute, and the price for BUSD did not drop below $0.975 at all, as shown in figure 21.
Figure 21
To analyze the weekend effect, we then repeated the analysis excluding weekends. None of the coins except for USDP fell below $0.95, as illustrated in figure 22 for USDC, USDT, DAI and BUSD.
Figure 22
Depeg events above $1 are both less frequent and of shorter duration. Figure 23 shows that in the 24 months ending June 2023, USDC, USDT and DAI did not depeg above $1.02.
Figure 23
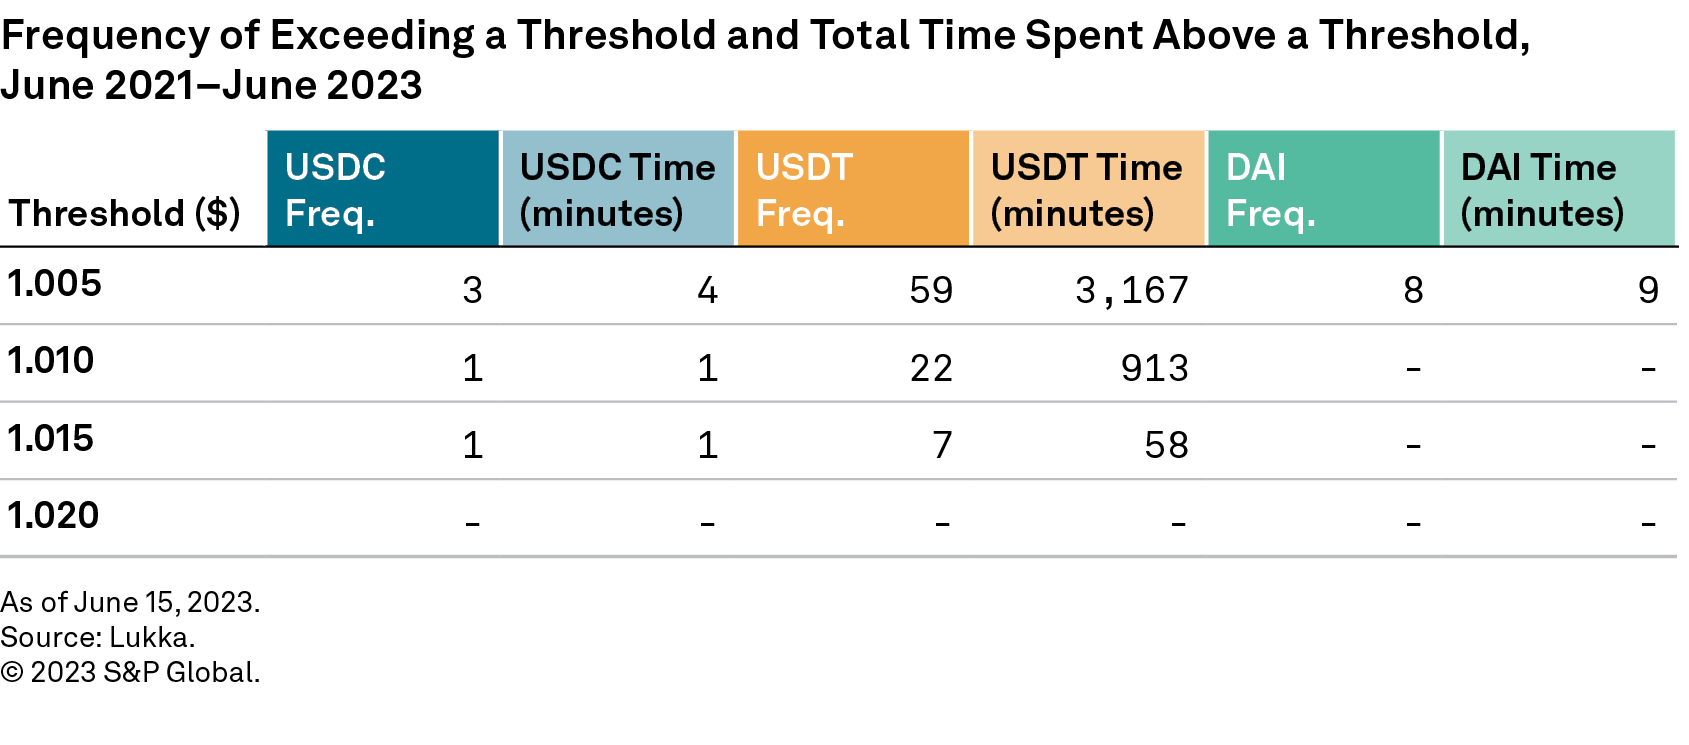
By contrast, BUSD and USDP depegged above $1.1. USDP exhibited 7,581 depeg events above $1.005 for a total depeg time of 51,217 minutes (about one month and five days). BUSD depegged 73 times above $1.005 for a total of 1,060 minutes (about 17 and a half hours). These figures drop significantly for higher thresholds. USDP stayed above $1.01 for a total of 3,732 minutes (about two and a half days) and above $1.1 for 26 minutes. Similarly, BUSD’s price exceeded $1.01 for 171 minutes (about three hours) and $1.1 for two minutes (see figure 24, where we show the analysis for thresholds equal to or higher than $1.01).
Figure 24
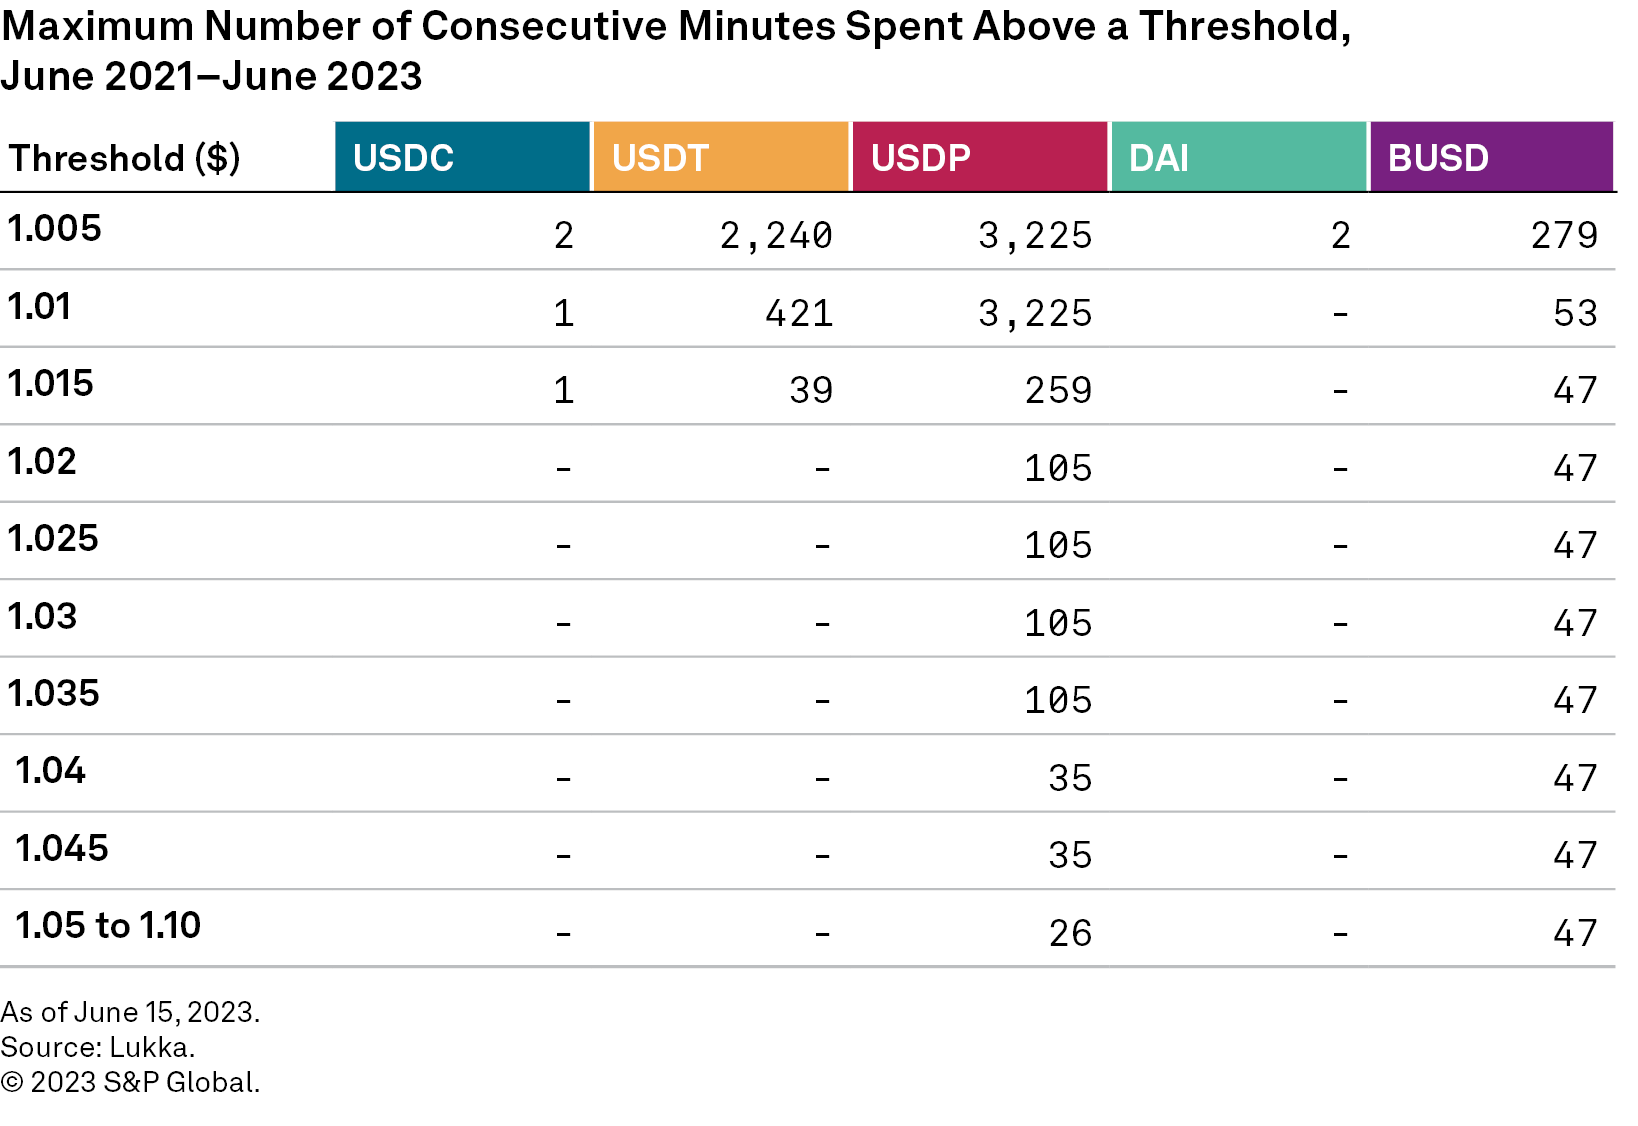
We then looked at the maximum number of consecutive minutes when the price stayed above a threshold and show it in figure 25. The longest depeg event above $1.005 for USDC and DAI was only two minutes. For BUSD, the longest depeg event above the $1.1 threshold lasted 47 consecutive minutes, and for USDP, 26 consecutive minutes.
Figure 25
Stablecoins have grown in popularity and there are 96 listed stablecoins (as of August 2023). They are expected to increase their role in the crypto ecosystem as it rapidly evolves alongside traditional finance. While stablecoins are meant to maintain a stable value, and therefore counter the high volatility of other crypto currencies, they are not immune to fluctuations in price, market capitalization and liquidity. A range of factors can cause stablecoins to depeg below or above the pegged value. They also differ in how often they depeg and for how long. Maintaining the peg and a stabilization mechanism requires good governance, adequate collateral and reserves alongside liquidity, market confidence and adoption.
- Stablecoins: Common Promises, Diverging Outcomes, June 15, 2022
- Stablecoin Depegging Highlights DeFi’s Exposure to TradFi Risks, March 15, 2023
- Are crypto markets correlated with macroeconomic factors? May 9, 2023
- The Fed’s Plan for U.S. Banks Should Reduce Contagion Risk, March 13, 2023
- DeFi Protocols For Securitization: A Credit Risk Perspective, Feb. 7, 2023
- A Deep Dive Into Crypto Valuation, Nov. 10, 2022
- Regulating Crypto: The Bid to Frame, Tame, Or Game the Ecosystem, July 13, 2022
Figures 26 through 30 show the price history since inception to mid-June 2023 for the five stablecoins in our study.
Figure 26
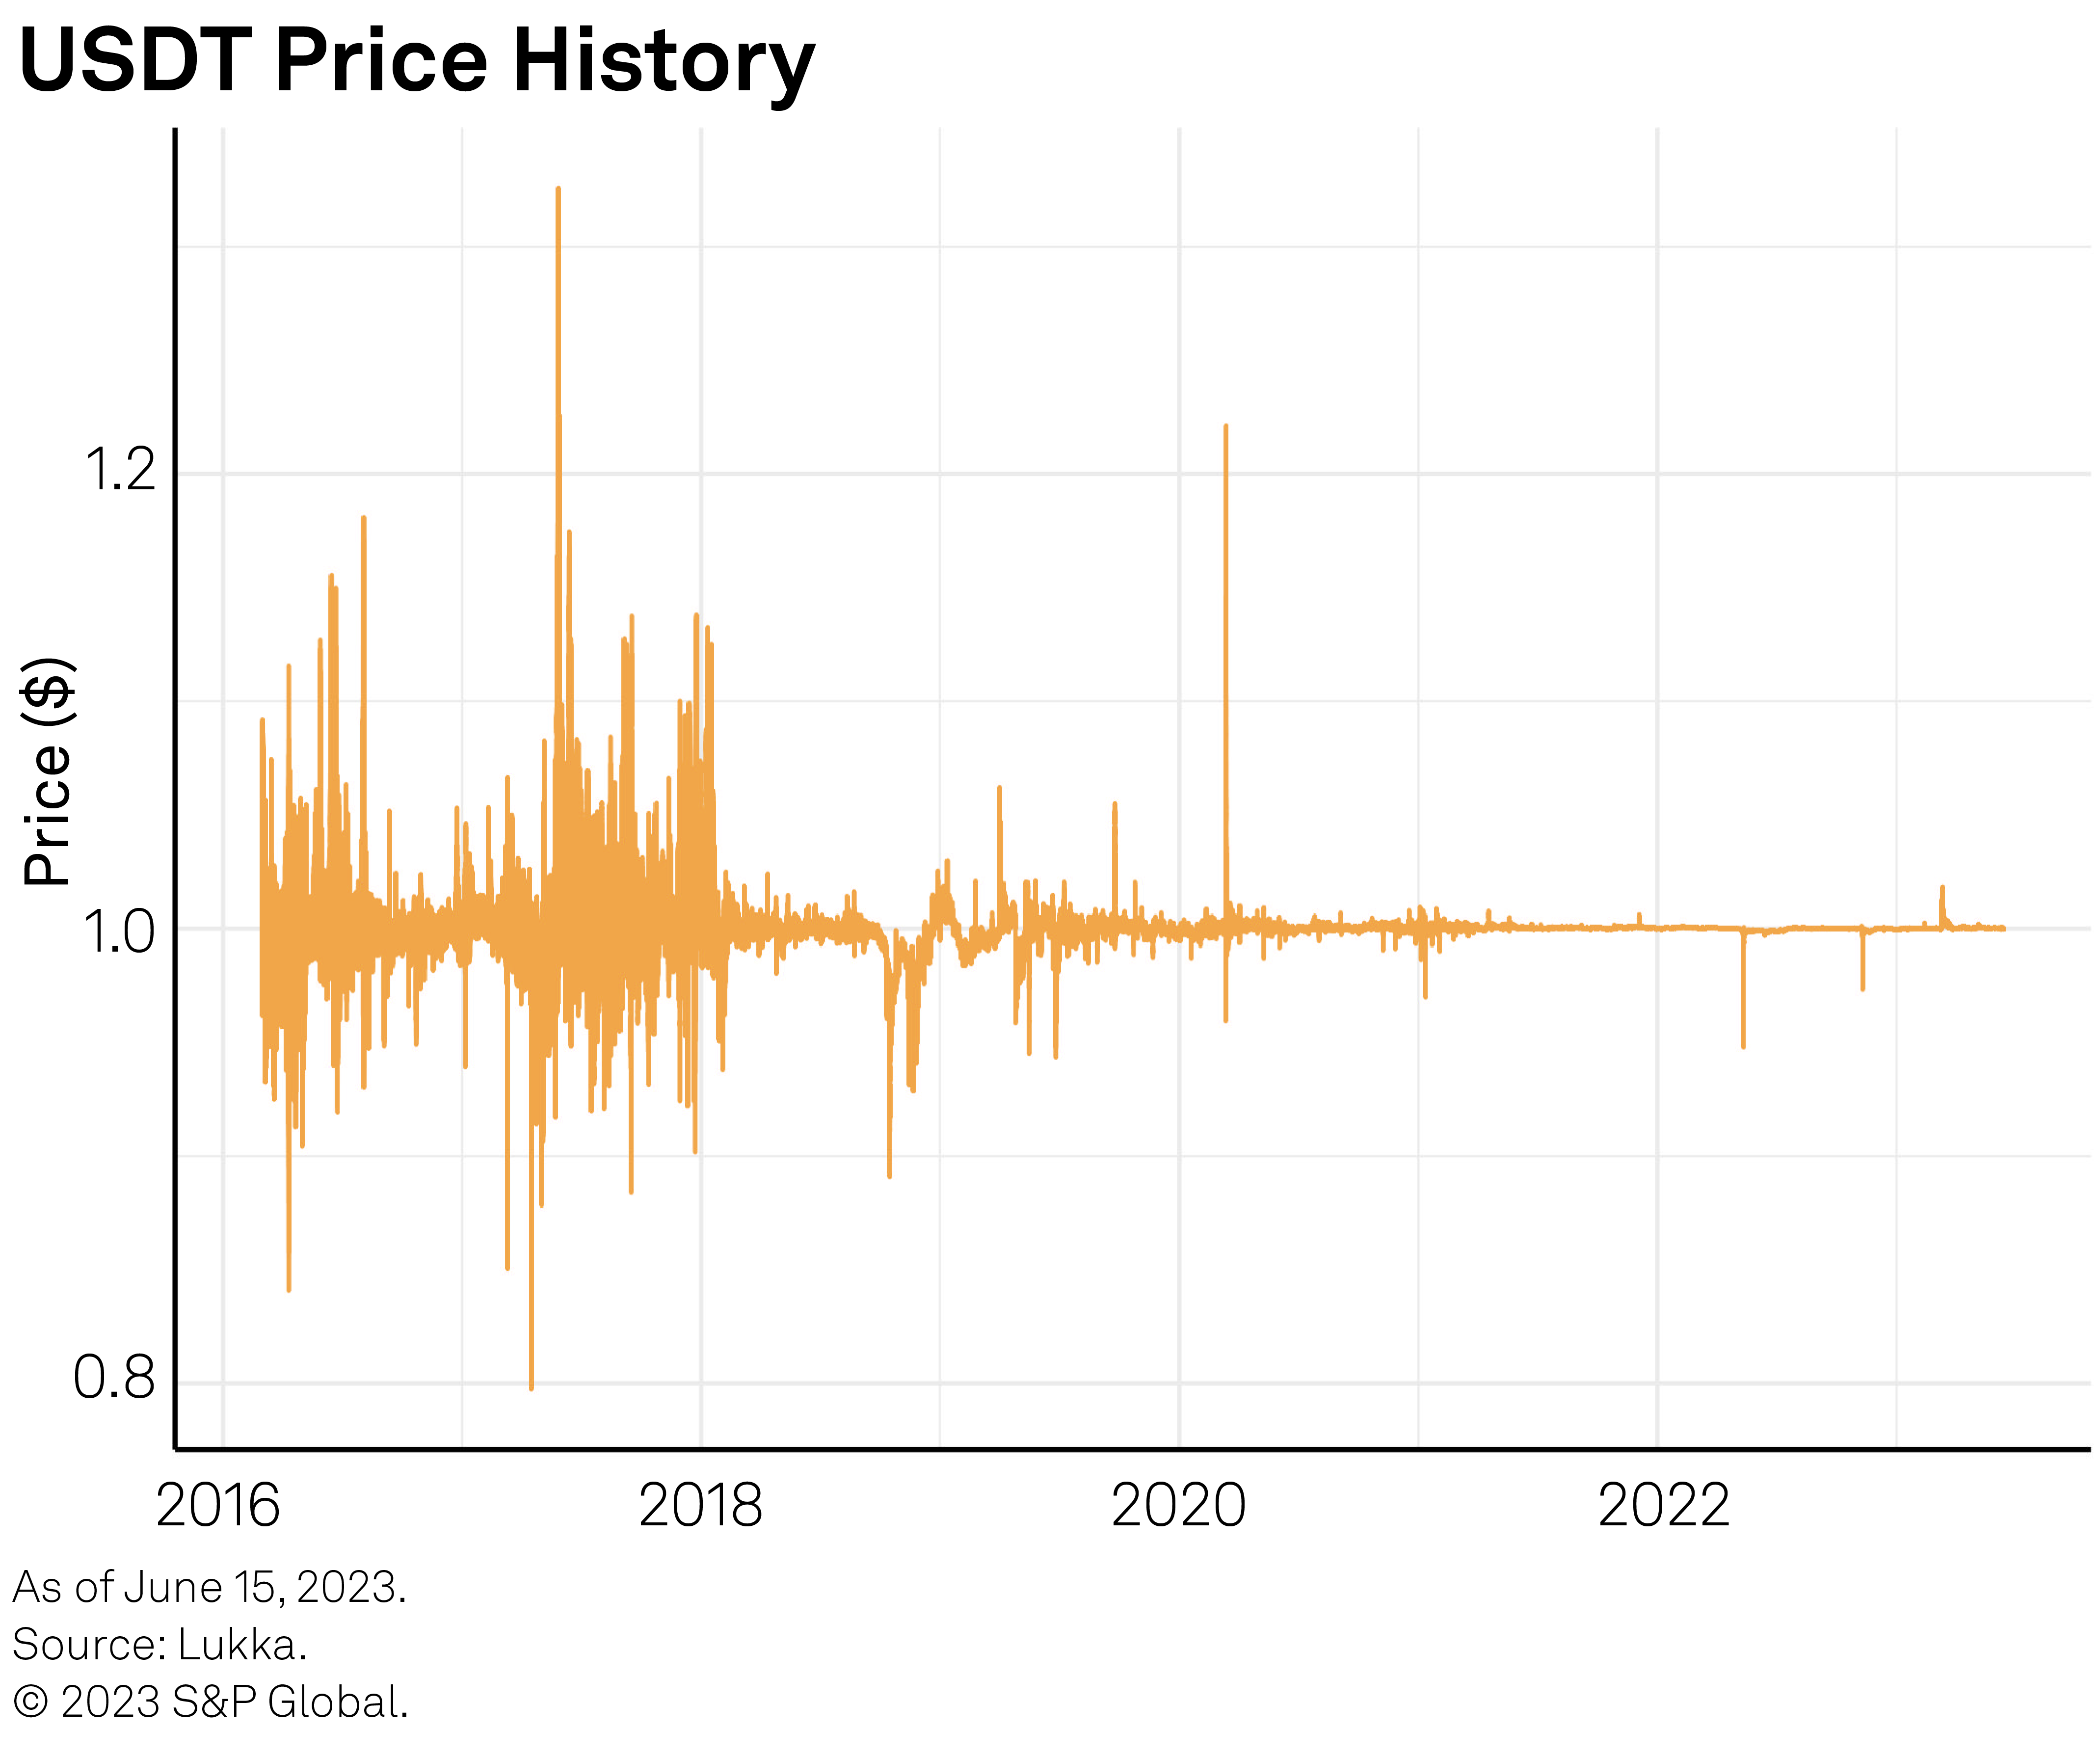
Figure 27
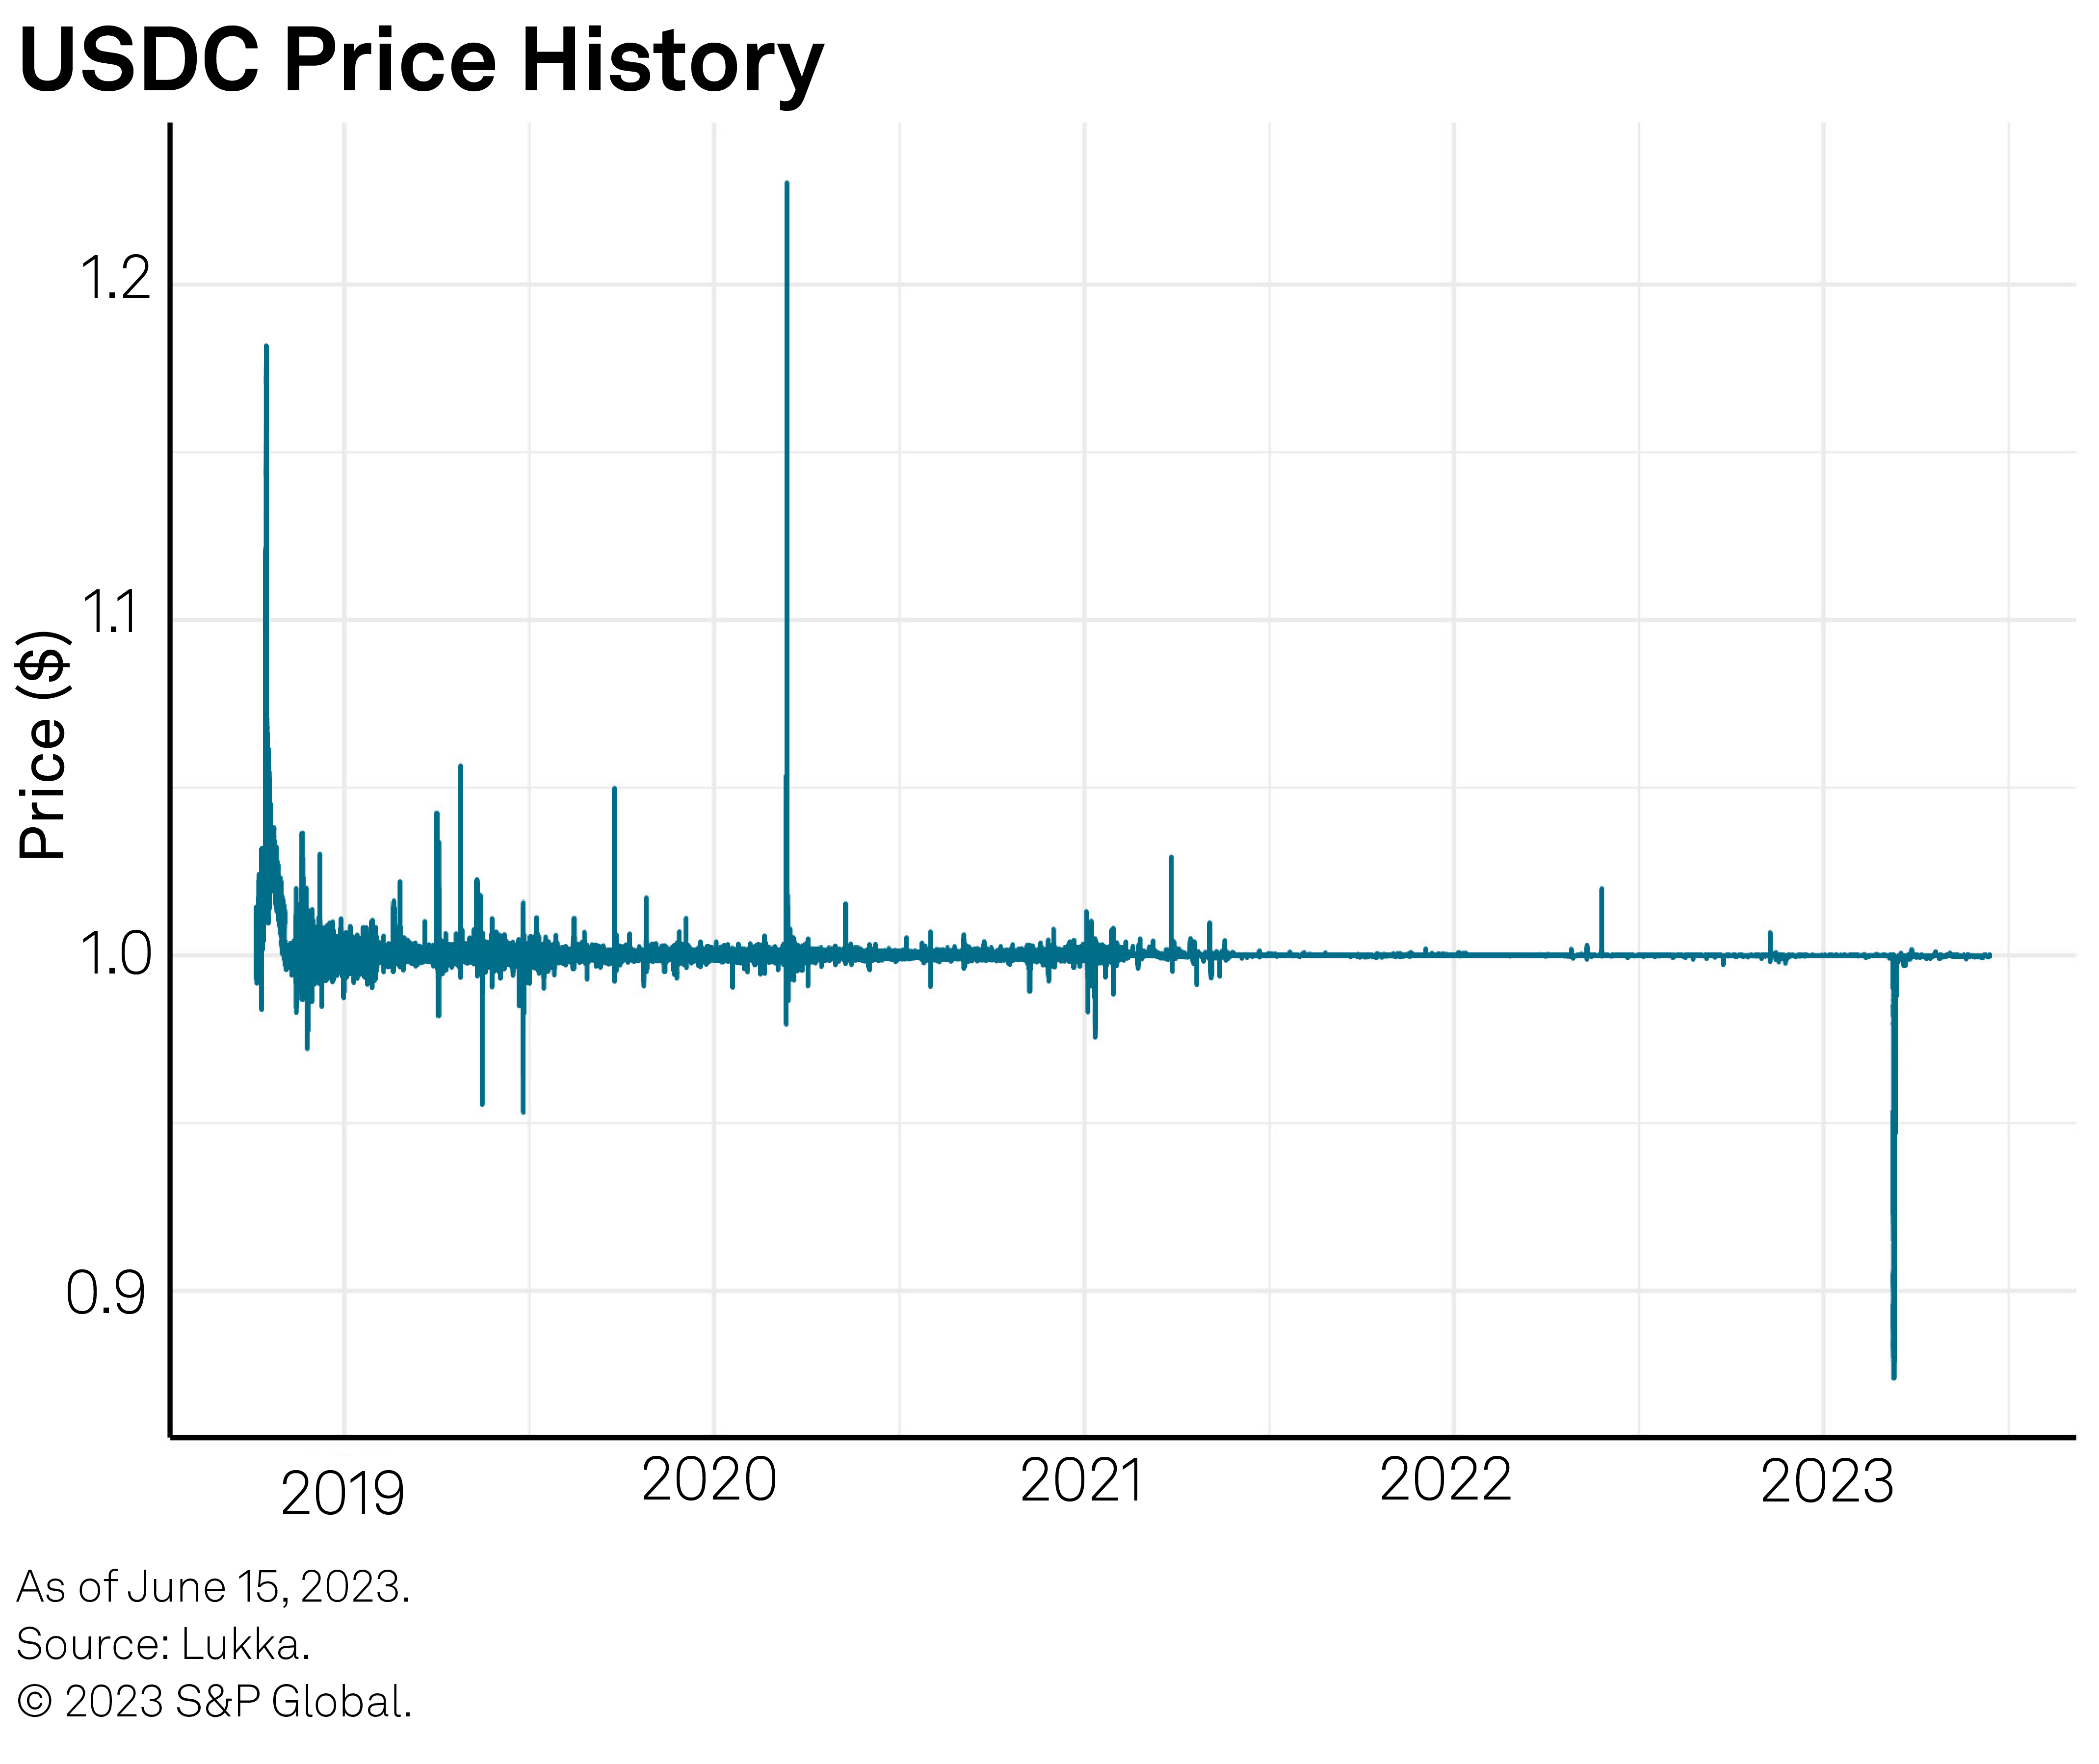
Figure 28
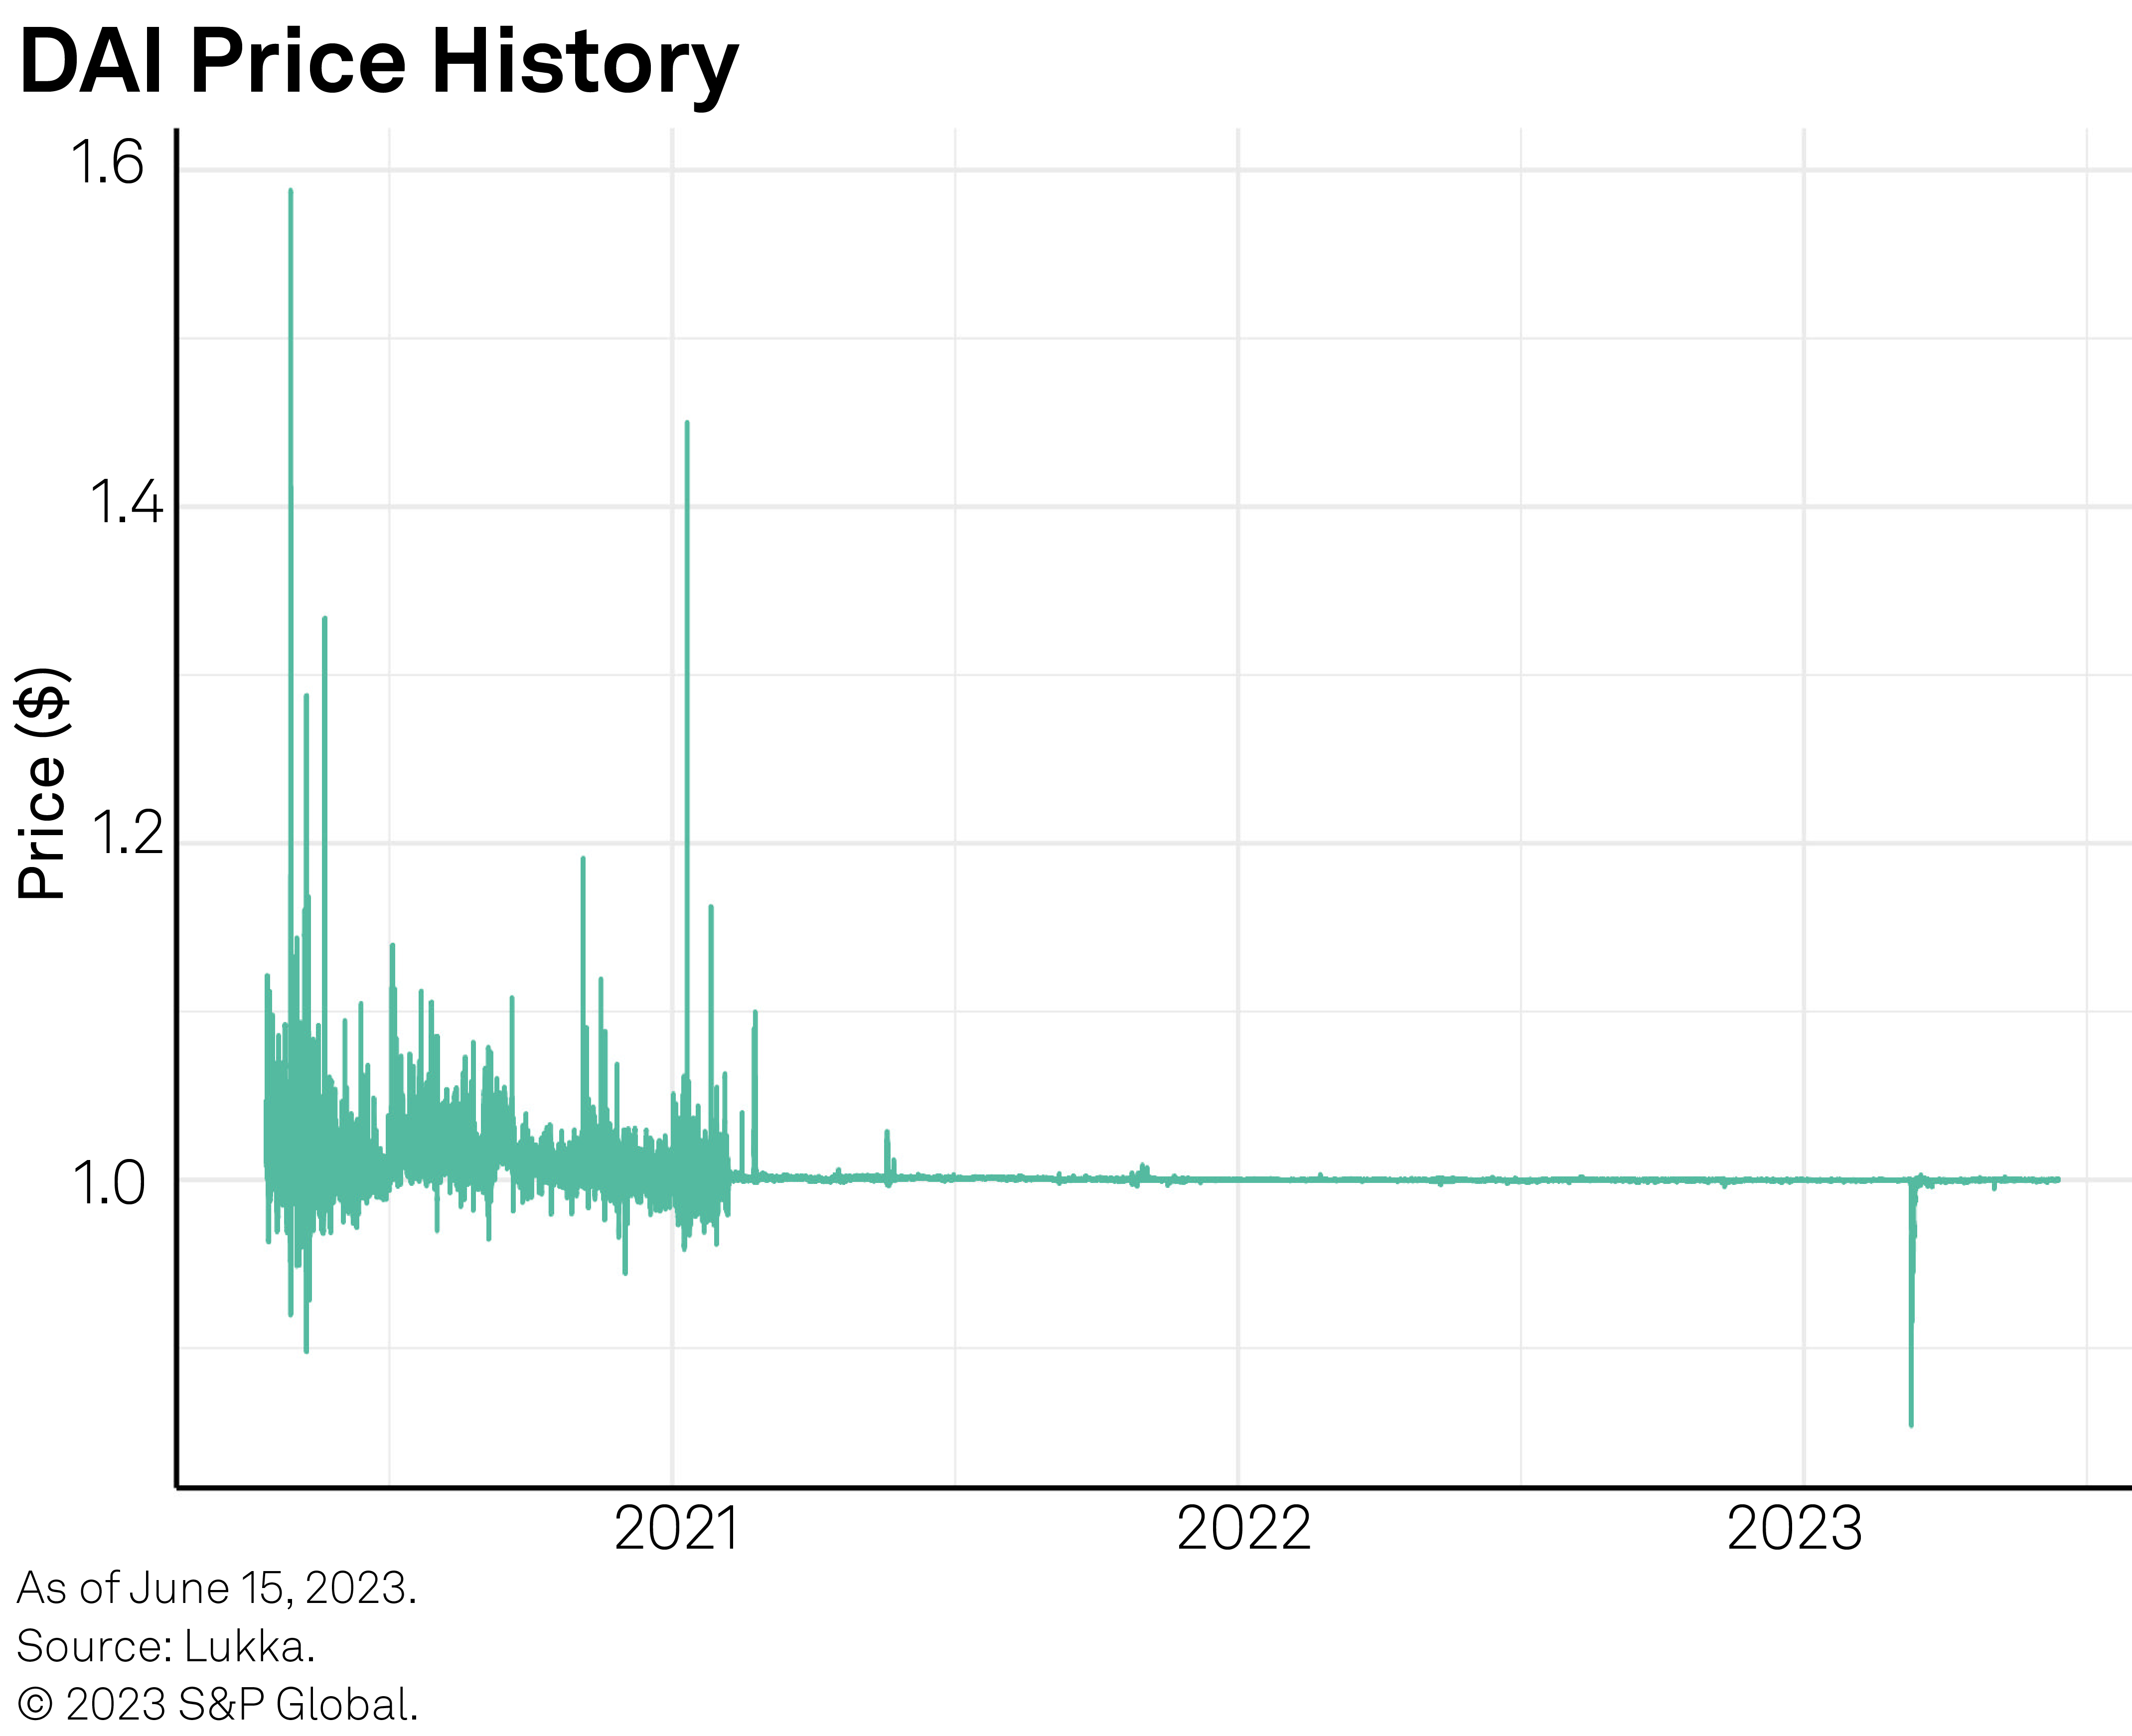
Figure 29
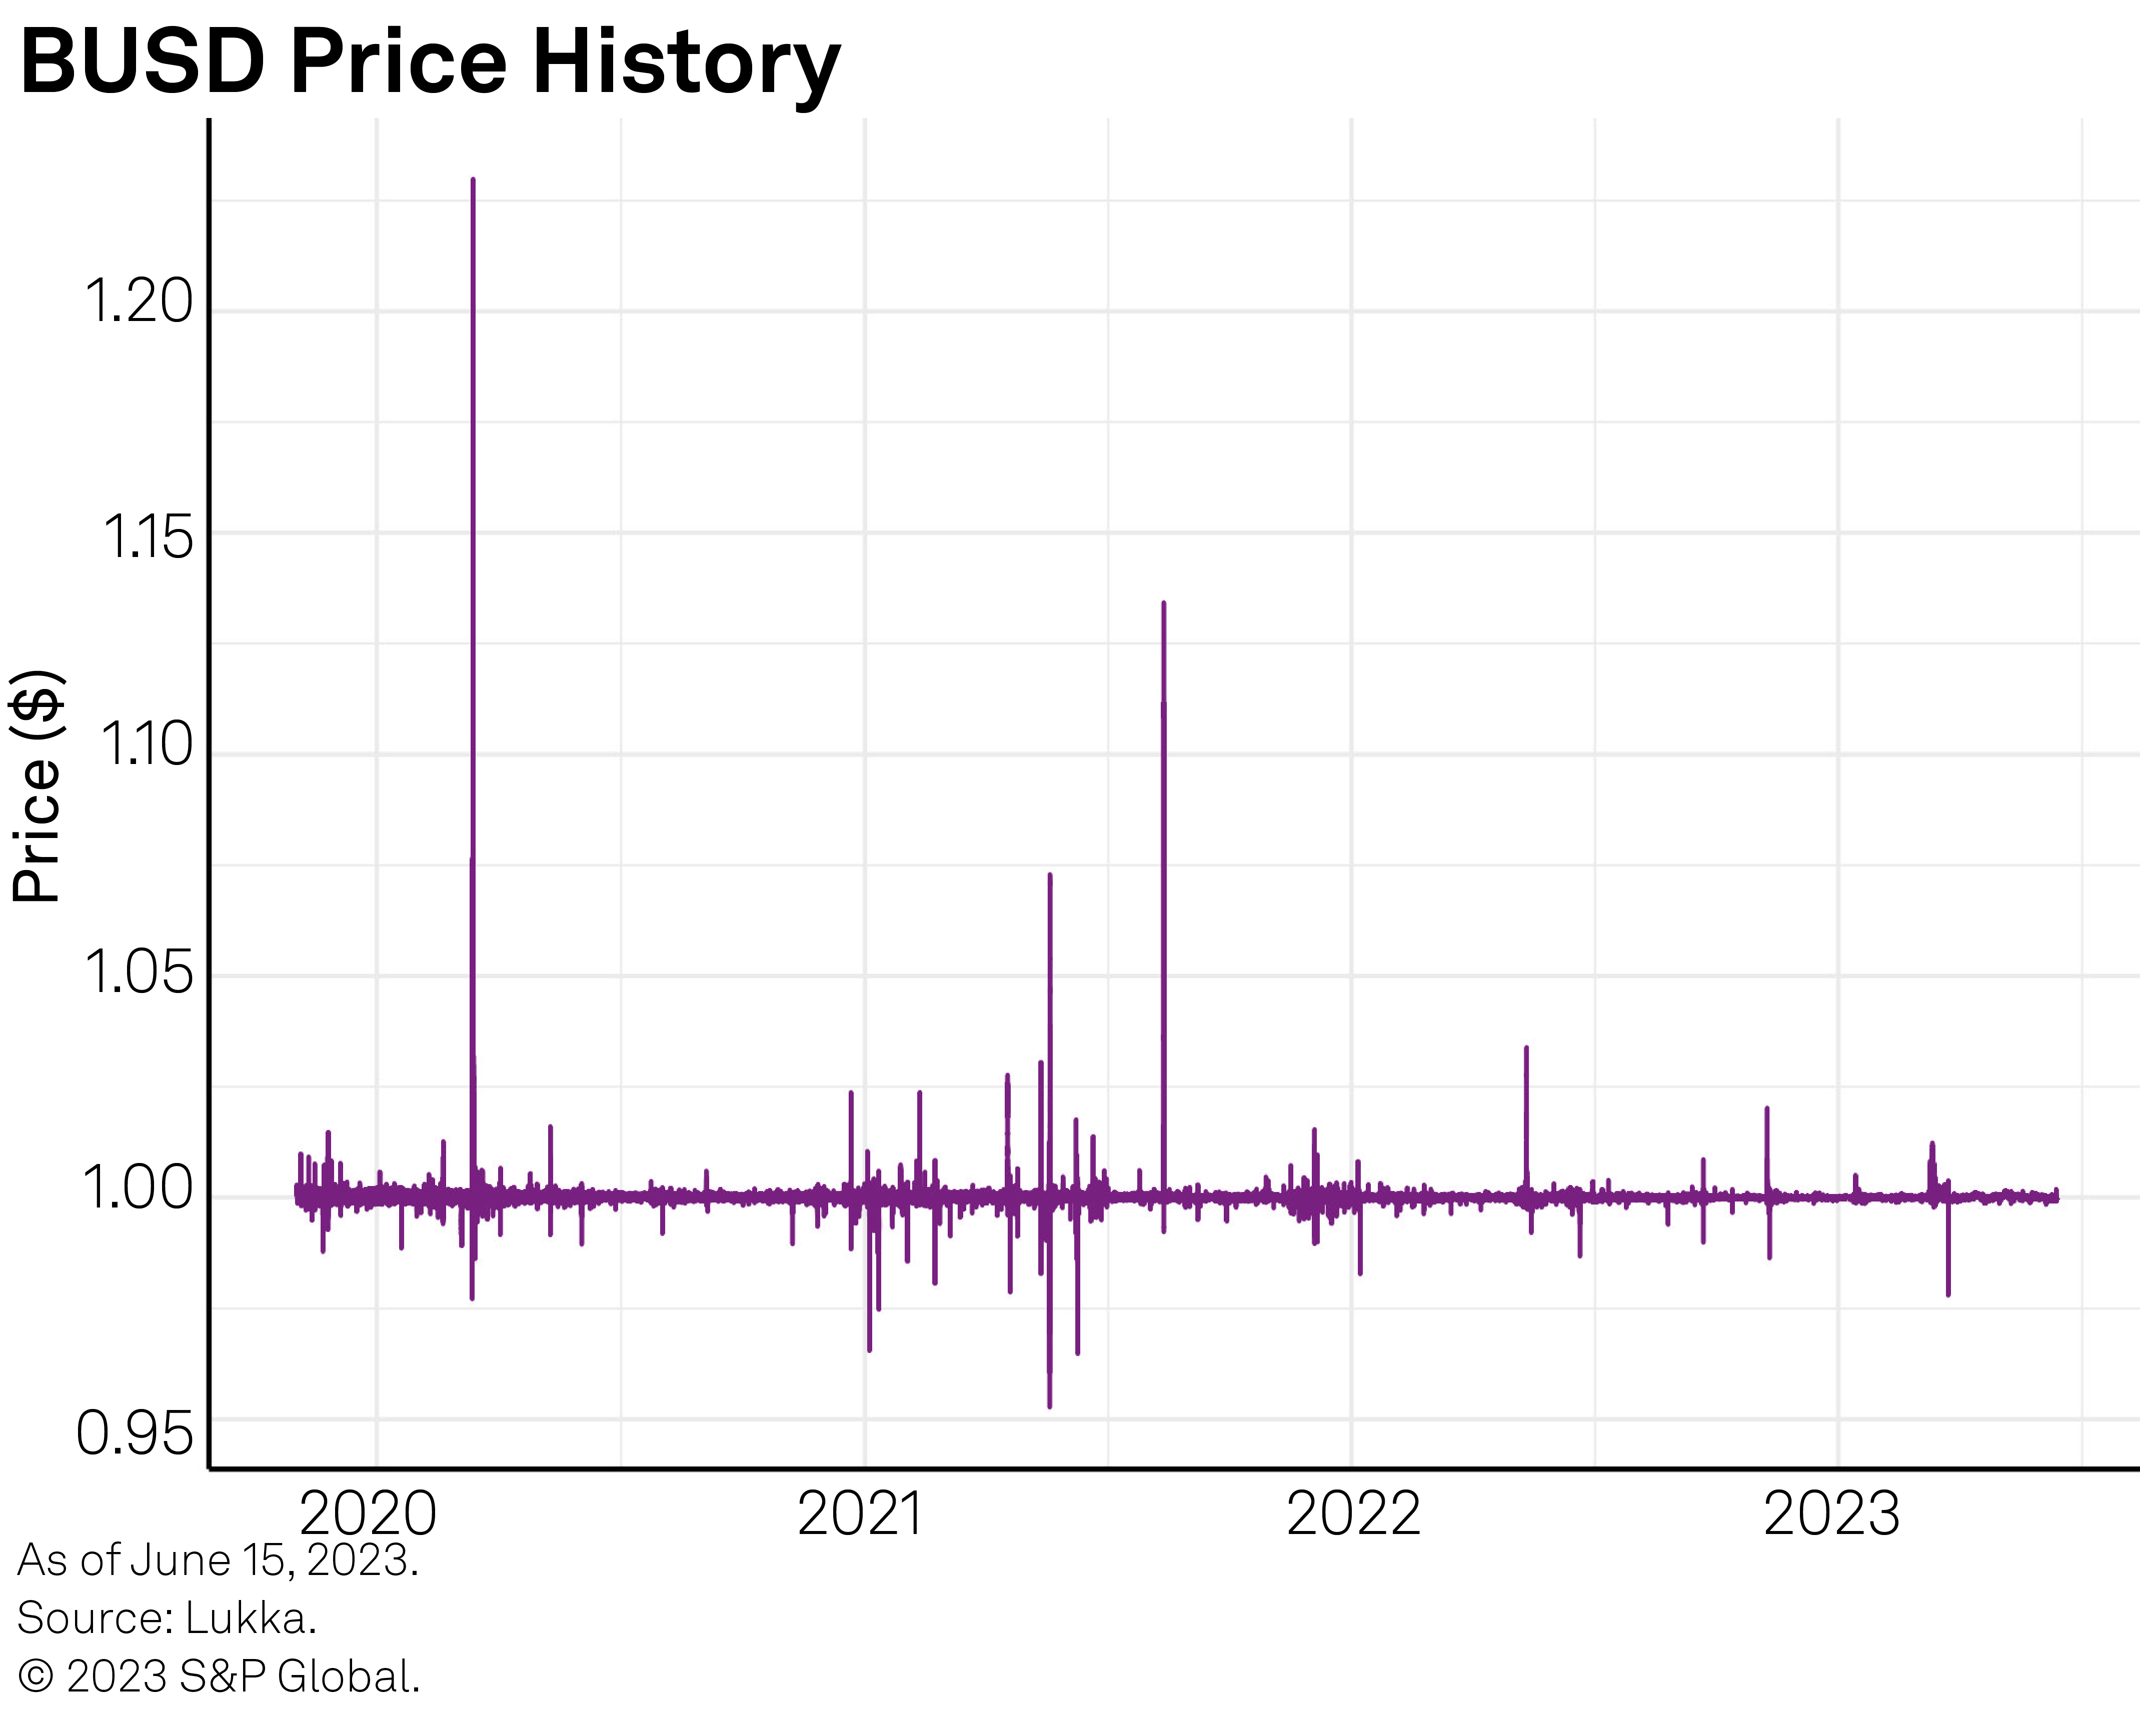
Figure 30